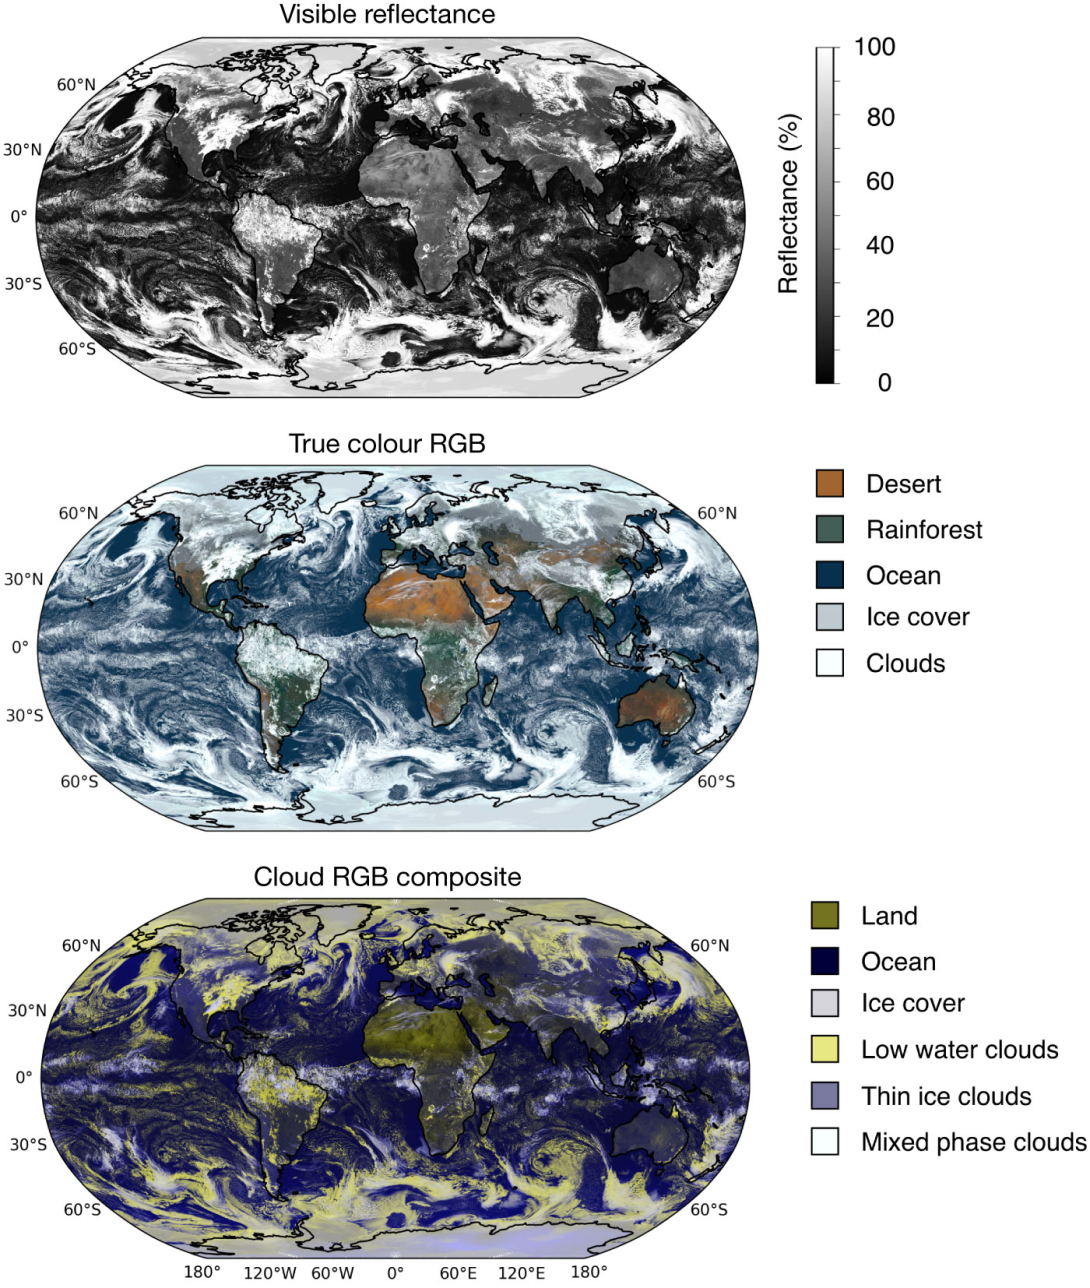
From Cycle 48r1 of ECMWF’s Integrated Forecasting System (IFS), implemented in June 2023, we have released simulated images for top-of-the-atmosphere visible reflectance operationally (top panel of the first figure). From this autumn, we will provide a version of these images based on visible reflectance from a range of wavelengths of reflected sunlight, representative of the images to be provided by the new Flexible Combined Imager (FCI) on the MTG-I1 satellite. The simulated images in colour can provide a better contrast between the Earth’s surface and the clouds, and they can better reveal the multiscale structure of the clouds above the ocean surface. By including a broader range of visible wavelengths of reflected light, the Saharan desert and deserts in Australia can be clearly distinguished from tropical rain forest coverage (middle panel). These images can also provide information on the cloud structure at different altitudes when including the infrared window channel (bottom panel). Forecasting clouds at the correct altitude and location is crucial for many applications, including aviation.

Visualising forecasts of vertical cloud structures
Clouds cover many altitudes, from the Earth’s boundary layer and stratiform clouds near coastal regions over the sea to thin cirrus clouds in the upper troposphere, where aircraft reach their cruising altitude. In the visible spectrum, water clouds, such as low stratus clouds near the west coast of South Africa, Chile, or California, can be easily discerned from the underlying surface. These clouds stand out from the underlying surface even though their respective temperature is comparable in the infrared spectrum. Further up in the troposphere, thin cirrus clouds can be almost transparent in the visible spectrum, but they are much colder than the underlying sea surface and can thus be clearly distinguished from the warmer ocean in the infrared window channel (10.5 micrometres). This means that visible and infrared wavelengths are very complementary in nature.
The information conveyed by these different wavelengths is used in a novel reflectance composite (bottom panel of the first figure). The yellow colour, which is a combination of the 640 and 865 nm bands, represents low-level clouds which strongly reflect solar light, while the intensity of the blue colour varies with the inverse of the normalised infrared brightness temperature in the 10.5 micrometre band. As a result, blue colours appear more intense for colder and thin cirrus clouds higher up in the troposphere, at the edge of very deep convective clouds. In regions with thick clouds (for example inside a tropical storm), the clouds appear white as a combination of high reflectance in the visible spectrum and cold temperatures in the infrared.
An illustration of a severe weather event over Europe
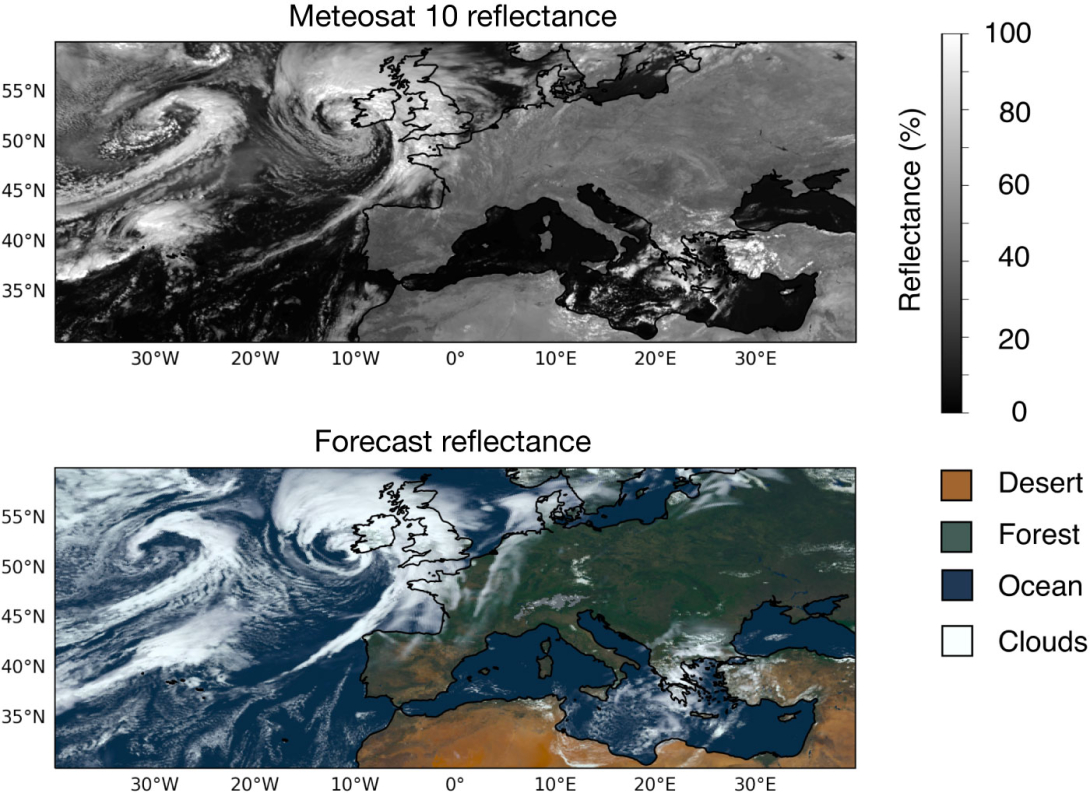
In September, a series of storms impacted the west coast of Great Britain (see the second figure).

Two cyclones followed each other within a timespan of one week. These cyclones carried intense precipitation, strong thunderstorms, and enhanced wind gusts. In a 36-hour forecast, the predicted synoptic scale structures, such as frontal systems spanning across the North Atlantic or the location of the cyclone cores, match well with observations. Over the course of the 36-hour forecast, local convective systems evolve at different locations, even though they all occur over the central Mediterranean.
Usefulness and availability
These newly enhanced products will become available as part of IFS Cycle 49r1, to be released this autumn. In this way, we will be able to visualise our forecasts of severe weather events across all simulated scales to support operational forecasters when estimating the probability of occurrence and location of clouds. In addition to other forecasting applications, these enhanced products are very useful in aviation, where thunderstorms inside mesoscale convective systems can have a severe impact on aircraft at cruising altitude, as well as in scenarios where very accurate forecasts of visibility are needed during start and landing.
