
Re‑forecasts of weather conditions during the Fastnet sailing race in August 1979 show that modern forecasting systems would have enabled much earlier warnings of a storm that claimed the lives of 15 sailors and 4 members of rescue teams. The re‑forecasts were produced using the global ICON model of the German national meteorological service (DWD) and the US Weather Research and Forecasting (WRF) limited-area model. ECMWF’s new ERA5 reanalysis provided the initial conditions and boundary conditions, respectively.
What happened
The Fastnet Race is a famous yachting race held in August every other year. Many hundreds of yachts, among them the sailing elite, sail from Cowes on the Isle of Wight along the southern coast of England and across the Celtic Sea up to the Fastnet Rock just southwest of Ireland, and then back to Plymouth. They cover 608 nautical miles in around three days, depending on weather conditions.
In 1979, this race resulted in the worst tragedy ever in the sport of sailing when, during the night of 13/14 August in the area south of Ireland, the yachts encountered an extremely violent storm. Two hundred yachts got into distress, five sank, 24 teams abandoned their vessels, and only 85 of the 303 yachts that started the race made it back to Plymouth. The rescue operation was one of the biggest since World War II, but the final toll was devastating: 15 sailors and 4 members of the many rescue teams died.
This disaster could be attributed to a number of causes, but one of the factors generally cited is a lack of early severe weather warnings. Forecast models at the time underpredicted the storm, which moved very quickly across the Atlantic as a shallow low but deepened almost explosively near Ireland, just as the yachts approached the Fastnet Rock. The sailors experienced gusts up to hurricane force that whipped up 10 to 15‑metre seas. On top of this, wind shifts associated with the passage of the system caused freak waves.
Accurately forecasting the Fastnet storm in 1979 was impossible. Very few satellite data were available, ship observations were partially contradictory, while the resolution of the forecast models used (the UK Met Office global model with a 300 km grid spacing and 10 vertical layers and its limited-area model with a 100 km grid spacing) was insufficient to cope with this unusual weather event. Furthermore, computer problems hampered the forecasting process. When the first observations showed the full extent of the storm, the participants could not be contacted immediately because the BBC Shipping Forecast, their main source of information, had just been transmitted. The fleet was thus engulfed by this disastrous storm when they had been expecting winds of Force 4, increasing 6 to 7, locally gale 8.
Two re-forecasts
A group of meteorologists at DWD took the opportunity of the 40th anniversary of this tragedy to run a re-forecast in order to investigate how a modern numerical forecasting system would deal with this unprecedented summer storm. The aim was to present an example of improvements in weather modelling during the last 40 years and to answer the question to what extent modern forecasting can enable earlier warnings of weather events such as the Fastnet Race storm.
We started from the new ERA5 reanalysis dataset from ECMWF and used the currently operational version of the ICON model, which has a grid spacing of 13 km and 90 vertical layers. In order to illustrate whether a current forecasting system would have given the race office good guidance on cancelling or delaying the event, we ran a 72‑hour re‑forecast from 00 UTC on 11 August 1979, the day the race started.
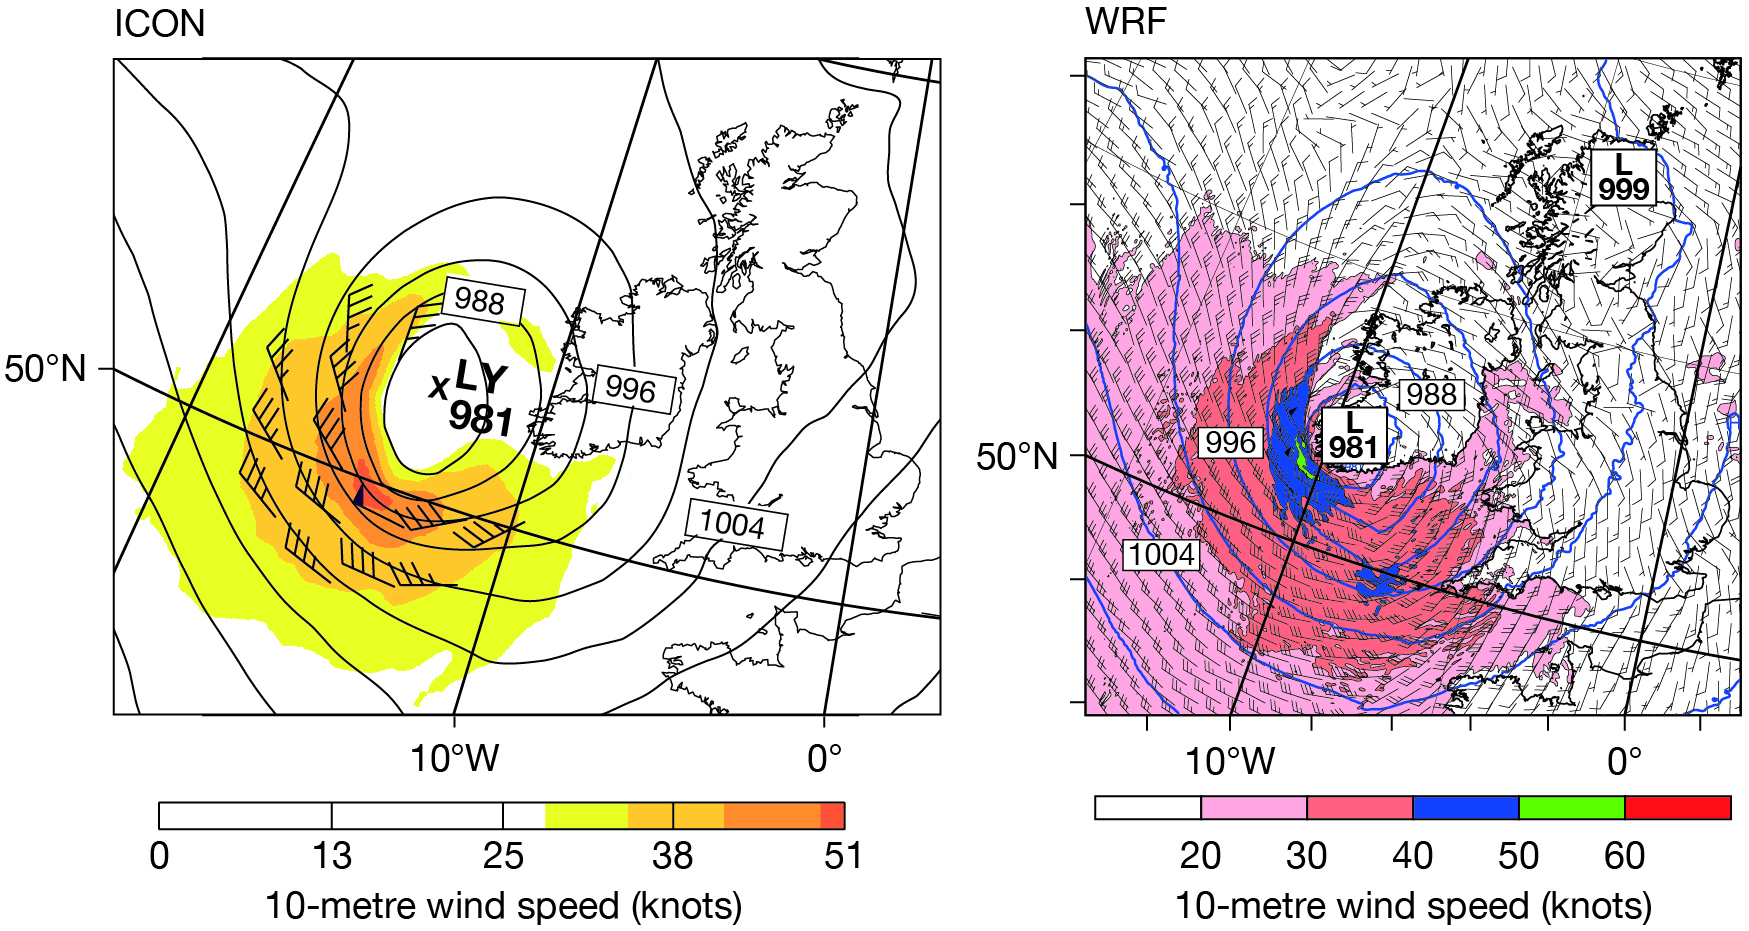
The left‑hand panel shows this re-forecast. It shows an extreme, fully developed storm close to the southwestern tip of Ireland with 50‑knot winds, exactly as observed. The model even predicts the correct minimum pressure. However, the predicted low is slightly displaced to the north compared to the observed position, and it is 3 to 6 hours behind the observed arrival time – very small differences for a 72‑hour forecast of this summer storm. Given the comparatively small observational base in 1979, this is a remarkable illustration of the improvements in weather forecasting since that time. Had such information been available in 1979, the race office would almost certainly have reacted, perhaps as they did in 2007, when the Fastnet Race was postponed by 25 hours due to the adverse weather outlook.
By coincidence, University College Dublin and the Irish Centre for High-End Computing (ICHEC) independently revisited the storm with a view to confirming its intensity – some of the race participants felt the winds were stronger than suggested by the official analysis detailed in the Fastnet Race Inquiry report (1979) – and to see how modern forecasts would perform. The WRF model version 4 was used with two domains, with a 2 km grid spacing for the inner domain and 60 vertical levels. Lateral boundary conditions were provided by ERA5 data. 3D-Var data assimilation was used to reanalyse the storm, based on conventional observations complemented with pressure observations from some of the yachts. This confirmed that winds reached violent storm force 11 on the Beaufort scale. Like the DWD re-forecast, the 75-hour WRF re-forecast shown in the right-hand panel, valid for 03 UTC on 14 August, captured the essential details of the storm. This is a remarkable achievement indicative of the progress made in numerical weather prediction since 1979. The two simulations described here also highlight the usefulness of reanalysis datasets such as ERA5, which provided the ‘guiding hands’ for these re-forecasts.
The Fastnet disaster of 1979 contributed to the reputation of the race as difficult and sometimes very demanding. In spite of this, the registration of yachts for the 340 places available in the 2019 race took just a few minutes.