
Satellite observations make a major contribution to the Earth system data which are routinely assimilated into models to determine the initial conditions for weather forecasts. Since the beginning of satellite data assimilation in the 1980s, most cloud-affected observations have been rejected following the ‘clear‑sky’ approach. This is because, in areas of cloud and precipitation, neither model forecasts nor the conversion of model values into satellite observation equivalents (observation operators) have been accurate enough. The machinery for using cloud and precipitation in data assimilation has needed decades of development, but the work is starting to pay off. A decade ago, ECMWF introduced direct ‘all‑sky’ assimilation of satellite radiances in the presence of cloud and precipitation. The aim was to extract more information in sensitive and under-observed areas, particularly in midlatitude fronts. We saw that four-dimensional variational data assimilation (4D‑Var) was able to infer updates to winds, temperatures and pressures from the location of cloud and precipitation in the observations, resulting in improved medium-range forecast quality in ECMWF’s Integrated Forecasting System (IFS). Recent progress in exploring the full potential of assimilating observations of cloud and precipitation has been substantial. In one stream of work, we have expanded the coverage of all-sky assimilation from a handful of microwave sensors with limited impact to now nine sensors that are a major part of the observing system. We aim to expand all-sky assimilation to the rest of the operational microwave and infrared sensors over the next few years, and we hope to add entirely new types of sensors aimed primarily at cloud and precipitation, such as the upcoming Ice Cloud Imager on EUMETSAT’s next generation of polar satellites. Progress has also been made in properly representing observation error correlations; using more observations over land surfaces; and exploiting the information provided by cloud and precipitation-affected radiances to further develop the modelling of moist processes in the atmosphere.
Increasing use of all-sky data
The first instruments to receive the ‘all‑sky’ treatment were microwave imagers, but this has been extended to currently nine humidity, cloud and precipitation-sensitive microwave sensors. These give around 15% of all observational impact, which is comparable with other influential components of the observing system (see Box A). Despite some scepticism in past decades, it is now clear that all-sky assimilation of microwave humidity-sensitive radiances is beneficial – indeed it can roughly double the impact of a satellite instrument compared to the clear‑sky approach.
A
Impact on forecasts
The impact of observations on the operational forecast is monitored by the ‘Forecast Sensitivity to Observation Impact’ (FSOI) diagnostic, which estimates the impact of each observation on a measure of global forecast errors at 24 hours lead time. The diagnostic requires computations in the short range but has been found to be broadly indicative of observation impact in the medium range. The FSOI diagnostic has been estimated operationally since 2012. It has recorded, among other things, the rising importance of microwave water-vapour sensitive data, most of which is assimilated with the all-sky technique. The figure shows the relative impact of different subsets of the global observing system, normalised so that the impact at every analysis cycle adds up to 100%, irrespective of long-term changes in the overall quality of forecasts. The relative impact of any one type of observation changes as techniques evolve and satellites are added to the system, or are lost to old age. For predominantly northern hemisphere data, such as aircraft, the impact varies with the seasons because the measure of global forecast error is dominated by the winter hemisphere. Occasional spikes are likely due to numerical instabilities in the FSOI calculations during sudden stratospheric warmings. The ‘microwave water vapour’ category contains the all-sky microwave data plus three similar sensors that have not yet been converted to all-sky assimilation. This category has comparable impact on forecast quality to the other main categories, such as microwave and infrared observations sensitive to temperature, aircraft observations and the rest of the conventional observing system (radiosondes, surface stations, ships and buoys). The relative impacts of different classes of observation, as seen in the FSOI, is broadly backed up by observing system experiments (OSEs), which measure the importance of observations by removing them from the system.


We have recently explored how far we can take the all‑sky approach. Infrared radiances are not yet operationally assimilated in all‑sky conditions, partly due to concerns about their more nonlinear sensitivity to cloud, particularly to its vertical overlap and sub‑grid variability. We have now experimentally demonstrated a small benefit from moving infrared humidity sounding channels into the all-sky approach, meaning that it would be feasible to start doing some level of all‑sky infrared assimilation in the operational system. As for temperature-sounding satellite data in both the microwave and infrared, the concern has been that cloud-related errors could adversely affect the temperature fields and destroy the analysis. If there are location errors in the cloud field of the short-range forecasts used in data assimilation (the background), then data assimilation should try to correct them by adding cloud at the observed location. However, it could also erroneously try to fit the observations by changing the temperature and moisture profile of the atmosphere. To prevent this occurring requires strong physical constraints in the data assimilation as well as background errors that are appropriately set. However, this may be difficult to achieve since cloud-related errors can be as large as 100 K when measured in terms of brightness temperature, whereas background temperature errors translate to around 0.1 K variations in observed brightness temperature.
Nevertheless, we have demonstrated an all-sky assimilation of Advanced Microwave Sounder – A (AMSU-A) data that gives around the same impact as clear-sky assimilation (Figure 1). We hope that with additional development it could become operationally viable in the next few years. Since all-sky assimilation runs in a separate framework to the old clear-sky approach, some of the biggest issues for AMSU‑A have been to do with replicating some apparently minor aspects of the clear‑sky framework, such as the exact data thinning pattern and the geophysical quality control. These aspects have been finely tuned over decades and, with the number of AMSU‑A sensors being assimilated and their substantial influence on forecast quality, even apparently minor details can have an impact.

For the future, any new microwave sensors that are added to our system will be implemented directly in the all‑sky framework. For example, we expect to use all‑sky assimilation for all three microwave and sub-millimetre sensors to be flown on EUMETSAT Polar System – Second Generation (EPS-SG) satellites from 2022 onwards. Over the next decade, we should be able to start using all remaining satellite radiance data in cloudy and precipitating conditions. This will both benefit the forecasts and help rationalise our system so that a common all-sky approach can be used throughout. In future, in the all‑sky framework we will also add completely new types of sensors whose atmospheric information content is dominated by clouds, such as imagers working at solar frequencies. Our development of all‑sky assimilation for passive satellite sensors goes in parallel with our developing ability to use active sensors, such as cloud radar and lidar, which will be reported separately.
Overcoming barriers to progress
Further progress will come from observation scientists adding more sensors and continuing to improve the accuracy and physical realism of the observation operator. For example, we are improving our microphysical representation of snow and graupel particles in the microwave scattering observation operator, and we hope to better represent the effects of preferential particle orientation, three-dimensional cloud and precipitation structures, and horizontal inhomogeneity. These improvements will enable us to have greater confidence in the observations, leading to the use of smaller observation errors or a reduced need for quality control.
Overcoming two further significant barriers could produce even more benefit from satellite radiance data. First, we need to use more observations over land and sea-ice surfaces, particularly over ice, snow and desert surfaces. The techniques that have worked for all-sky assimilation – fast approximate observation operators and observation errors that inflate in difficult situations – should also help over land surfaces. Second, we need to use more of the data at higher spatial resolution. At present, we have to thin most satellite data down to around 100 km scales because spatial observation error correlations are not yet modelled in the data assimilation. To improve, we need to start modelling spatially correlated observation errors in the data assimilation process.
All-sky data over land surfaces
Currently only the 183 GHz and 118 GHz humidity- and temperature-sounding channels are assimilated in all-sky conditions over land, taking advantage of their generally small sensitivity to the surface. These channels provide information on mid- and upper-tropospheric humidity and on snow and ice particles in the atmosphere. Many other microwave imager channels have sensitivities to low-level rain and water cloud. They thus have the potential to provide information that is almost unique in land areas that are poorly covered by ground-based sensors. However, these channels are currently discarded due to their high sensitivity to the surface. The difficulty is the poor accuracy in the simulated brightness temperatures due to uncertainties in the emissivity and skin temperature over land. All‑sky assimilation adds the difficulty of separating errors in cloud and precipitation from those in the description of the surface. Currently, surface emissivity is retrieved from the observations themselves as part of the data assimilation process. This estimate is only accurate enough when clouds are semi-transparent to microwave radiation. In situations of heavy precipitation, the surface is not visible and emissivity values from an emissivity atlas are taken instead. To provide more accurate estimates, a ‘constrained emissivity retrieval’ is being tested. In this method, the emissivity retrieval at a low frequency (where the sensitivity to clouds and precipitation is minimal) is extrapolated to other channels, using the frequency-dependence recorded in the atlas.

Figure 2 illustrates the additional information we could gain over land surfaces. Based on the same profile of humidity and temperature, we have simulated the brightness temperature change due to adding a liquid water cloud over a grass surface and over an ocean surface. Over the ocean, because of the relatively cold radiating temperature of a water surface, liquid clouds have an impact of over 40 K at 89 GHz in horizontally polarised channels. Over land, for the same channel the effect of the same water cloud is just 4 K. Hence over land we have a smaller signal to work with and bigger errors in the surface emissivity to contend with. Nevertheless, information on water cloud over land surfaces from other sources is extremely limited, and getting it right is important to the surface radiation budget and to near-surface temperature forecasts. Hence, there is strong motivation for improving our representation of the surface characteristics to be able to use the information on water clouds and liquid precipitation available from microwave observations. Beyond this, microwave observations, particularly at lower frequencies, are crucial parts of the observing system for soil moisture, vegetation and snow cover. If the atmospheric sensitivities of microwave observations have been well represented, that should make it easier to simultaneously infer information on the surface characteristics. Hence the ultimate goal is to use our land surface model to drive a physical land emissivity model, but it will take some development work before its accuracy can beat the emissivity retrieval approach.
Representing observation error correlations
The modelling of observation error correlations has already benefitted the assimilation of clear-sky observations. For example, the move to inter-channel error correlations for hyperspectral sounders provided significant benefit to forecast scores. The operational all-sky approach does not yet represent observation error correlations, but the presence of cloud and precipitation has a substantial impact on them, for example increasing the correlations between channels. Further, the presence of cloud affects spatial correlations, but its exact effect is still unclear. On the one hand, it could shorten the distances over which these errors are correlated down to the scales of the cloud or precipitation features themselves. On the other hand, the distances over which these error correlations are important could also become longer where there are systematic errors or biases in particular cloud regimes.
To demonstrate all-sky infrared assimilation of hyperspectral water vapour sounding channels, an error correlation model was successfully devised. It includes careful filtering of the error covariance matrix. This was needed to prevent the amplification of subtle inter-channel bias signals and gravity waves with relatively short vertical periodicity. Both effects can degrade the analysis, through changes in the model climate and/or through the introduction of additional gravity wave activity in the model propagating into the stratosphere. The development of interchannel error correlation models for the all-sky microwave imagers is proceeding, but with some difficulty, possibly partly due to changes in the analysed climate when correlations are represented. It is likely that observation error modelling will continue to require significant research and development effort in the future, particularly when it comes to all‑sky assimilation.
Evaluating systematic errors in the forecast model
Progress in all-sky assimilation can help to improve not just the initial conditions but also the forecast model. For example, combining satellite radiances from many different frequencies should extract more information on microphysical details like the shapes and sizes of cloud and precipitation particles. Combining that with information from active sensors and ground instruments, we could reach a point of ‘microphysical closure’ (Box B).
B
Microphysical closure
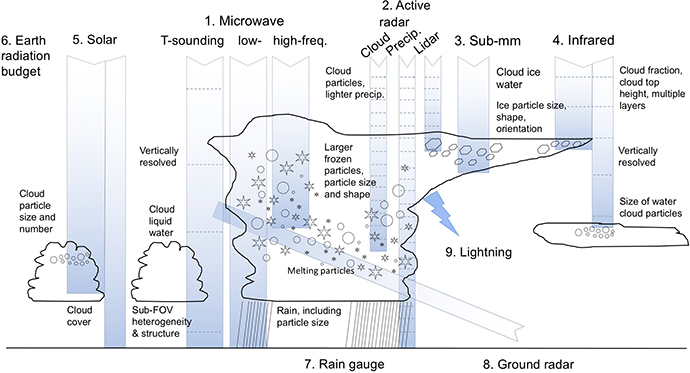
By the end of the next decade, we could be assimilating a huge amount of satellite and ground data sensitive to cloud and precipitation. In-situ measurements of cloud and precipitation are not possible on a global scale, so almost everything is a remote measurement of some form or other. The bulk of cloud and precipitation information comes from ‘passive’ satellite measurements of the upwelling electromagnetic radiation from the Earth. Because of the way radiation interacts with particles, the greatest sensitivity to the microphysical details of cloud and rain in the atmosphere occurs when the wavelength of the radiation is close to the size of the particles. For example, microwave wavelengths are from around 30 cm to 1 mm giving, as the wavelength decreases, increasing sensitivity to microphysical details (size, shape, and orientation) of first raindrops, then snow and hail. As the wavelength decreases, the frequency increases, so often the microwave region is roughly split, as in the diagram, into ‘low-’ and ‘high-’frequency regions, based on whether the primary sensitivity is to the liquid or ice phase. Sub-mm wavelengths have sensitivity to smaller cloud ice particles, whereas infrared and visible wavelengths cover down to around 0.4 microns, with increasing sensitivity to the number concentration (and hence size) of cloud water droplets. Passive measurements tend to see the integrated contribution from many levels of the atmosphere or they may just see the top of a cloud. ‘Active’ instruments measure the backscatter from particles and are able to provide profiles through the depth of a cloud. At microwave wavelengths, the active approach is known as radar, with sensitivity to precipitation and cloud; at visible wavelengths, the approach is known as lidar and is mainly aimed at cloud particles. In addition, we can use ground radar and rain gauges, and lightning measurements from satellites. Although our original focus has been on improving initial conditions for forecasting, such a range of microphysical sensitivities available from the global observing system can also support efforts to improve the forecast model, to reach a point of ‘microphysical closure’ where the source of errors in the forecast model is made obvious through the overlapping sensitivities of different observation types.
In a previous Newsletter article (Forbes et al., 2016), we showed how a combination of all-sky microwave imagers, lidar cloud retrievals (from CALIPSO) and broadband radiation budget measurements (from CERES) helped to identify a lack of supercooled liquid water in convective cold-air outbreaks at high latitudes over the ocean. Potential solutions were tested and a series of changes made to the cloud and convection processes in recent IFS upgrades to significantly reduce mean top-of-the-atmosphere shortwave radiation errors, particularly since June 2019 with the implementation of IFS Cycle 46r1. However, a re-evaluation of microwave brightness temperature departures with the latest IFS cycle shows there is some compensation of errors with still too little supercooled liquid water in much of the cold-air outbreak region where the cloud is deeper, but now too much supercooled liquid water in the shallower boundary layer cloud regime. Hence, the all-sky evaluation within the data assimilation system is showing the need for further improvement of the supercooled cloud processes.
With increasing use of all-sky observations, including for a wider range of frequencies, we hope to shed light on other aspects of the model representation of cloud and precipitation. This should make it possible to further increase the realism of the model. One new example is an apparent lack of coverage of convective cloud over land surfaces in the model revealed by experimental all-sky infrared assimilation. This is shown in Figure 3 for three different channels representing different altitudes. Over the central US, southern parts of South America, northern India and much of the equatorial areas of Africa, blue colours indicate a substantial mean bias between the model and observations suggesting the model is lacking convective cloud. This is supported by the all-sky microwave observations over land at 183 GHz, sensitive to precipitation-sized ice particles, which also suggests a lack of frozen precipitation in these regions (not shown). Currently the observation operator for this channel needs to artificially boost the effect of model precipitation over land surfaces, for better agreement with observations and to permit assimilation of the data. This could be removed if the model cloud and precipitation representation were improved in these regions. Figure 3 also shows differences between the model and the all-sky infrared observations elsewhere, suggesting other possible issues with IFS cloud forecasts, but more work is needed to draw firm conclusions.

We aim to continue to improve the representation of cloud and precipitation in the IFS through close cooperation between observation and model experts, which is essential for interpretation and drawing firm conclusions on present shortcomings. Even then, it can be a challenge to improve the model physics to remedy the problem without degrading other aspects of forecast performance. For the future, there are opportunities to re-examine the model development process, taking inspiration from recent successes with machine learning, but likely working within the data assimilation framework so as to constrain updates based on prior knowledge and to weigh that against the errors in the new information coming from observations.
Next steps
We aim to work towards a complete all-sky, all-surface assimilation that benefits from different cloud and precipitation sensitivities across the electromagnetic spectrum and from active and passive sensors. Observations of cloud and precipitation are coming in ever greater numbers and variety, but because they are indirect measurements in terms of radiance or reflectivity, they need a high-quality data assimilation system to make use of them. We need to make much better use of information that is currently discarded, with continuing efforts to improve observation operators and observation error modelling, as well as improvements to the forecast model. To achieve this, observation, data assimilation and modelling experts will have to work together to make the best use of observations of cloud and precipitation. Over the next decade this should bring us to a point where our forecasting system can make full and automatic use of cloud and precipitation observations both to inform the initial conditions and to develop the model itself.
Further reading
Forbes, R., A. Geer, K. Lonitz & M. Ahlgrimm, 2016: Reducing systematic errors in cold-air outbreaks. ECMWF Newsletter No. 146, 17–22, doi:10.21957/s41h7q7l.
Geer, A. J., M. Matricardi & S. Migliorini, 2019: All-sky assimilation of infrared radiances sensitive to mid- and upper-tropospheric moisture and cloud, Atmospheric Measurement Techniques, 12, 4903–4929, doi:10.5194/amt-12-4903-2019.
Geer, A.J., K. Lonitz, P. Weston, M. Kazumori, K. Okamoto, Y. Zhu, E.H. Liu, A. Collard, W. Bell, S. Migliorini, P. Chambon, N. Fourri, M.‑J. Kim, C. Köpken‐Watts & C. Schraff, 2018: All‐sky satellite data assimilation at operational weather forecasting centres. Q.J.R. Meteorol. Soc., 144, 1191–1217, doi:10.1002/qj.3202.
Geer, A.J., F. Baordo, N. Bormann, P. Chambon, S.J. English, M. Kazumori, M. Lawrence, P. Lean, K. Lonitz & K. Lupu, 2017: The growing impact of satellite observations sensitive to humidity, cloud and precipitation. Q.J.R. Meteorol. Soc., 143, 3189–3206, doi:10.1002/qj.3172.
Weston, P., A.J. Geer & N. Bormann, 2019: Investigations into the assimilation of AMSU-A in the presence of cloud and precipitation, EUMETSAT/ECMWF Fellowship Programme Research Report No. 50.