The European summers of 2018 and 2019 were both record breaking, but in different ways. While the summer of 2018 broke the record for the highest seasonal average temperature in many places, in 2019 national all-time maximum temperature records tumbled in Belgium, France, Germany, Luxembourg, the Netherlands and the UK. The national records were broken during two relatively short but extreme episodes of heat that hit western Europe at the end of June and the end of July 2019. Both episodes were relatively well predicted although inaccuracies in the prediction of a Rossby wave over the US hampered the June forecasts.
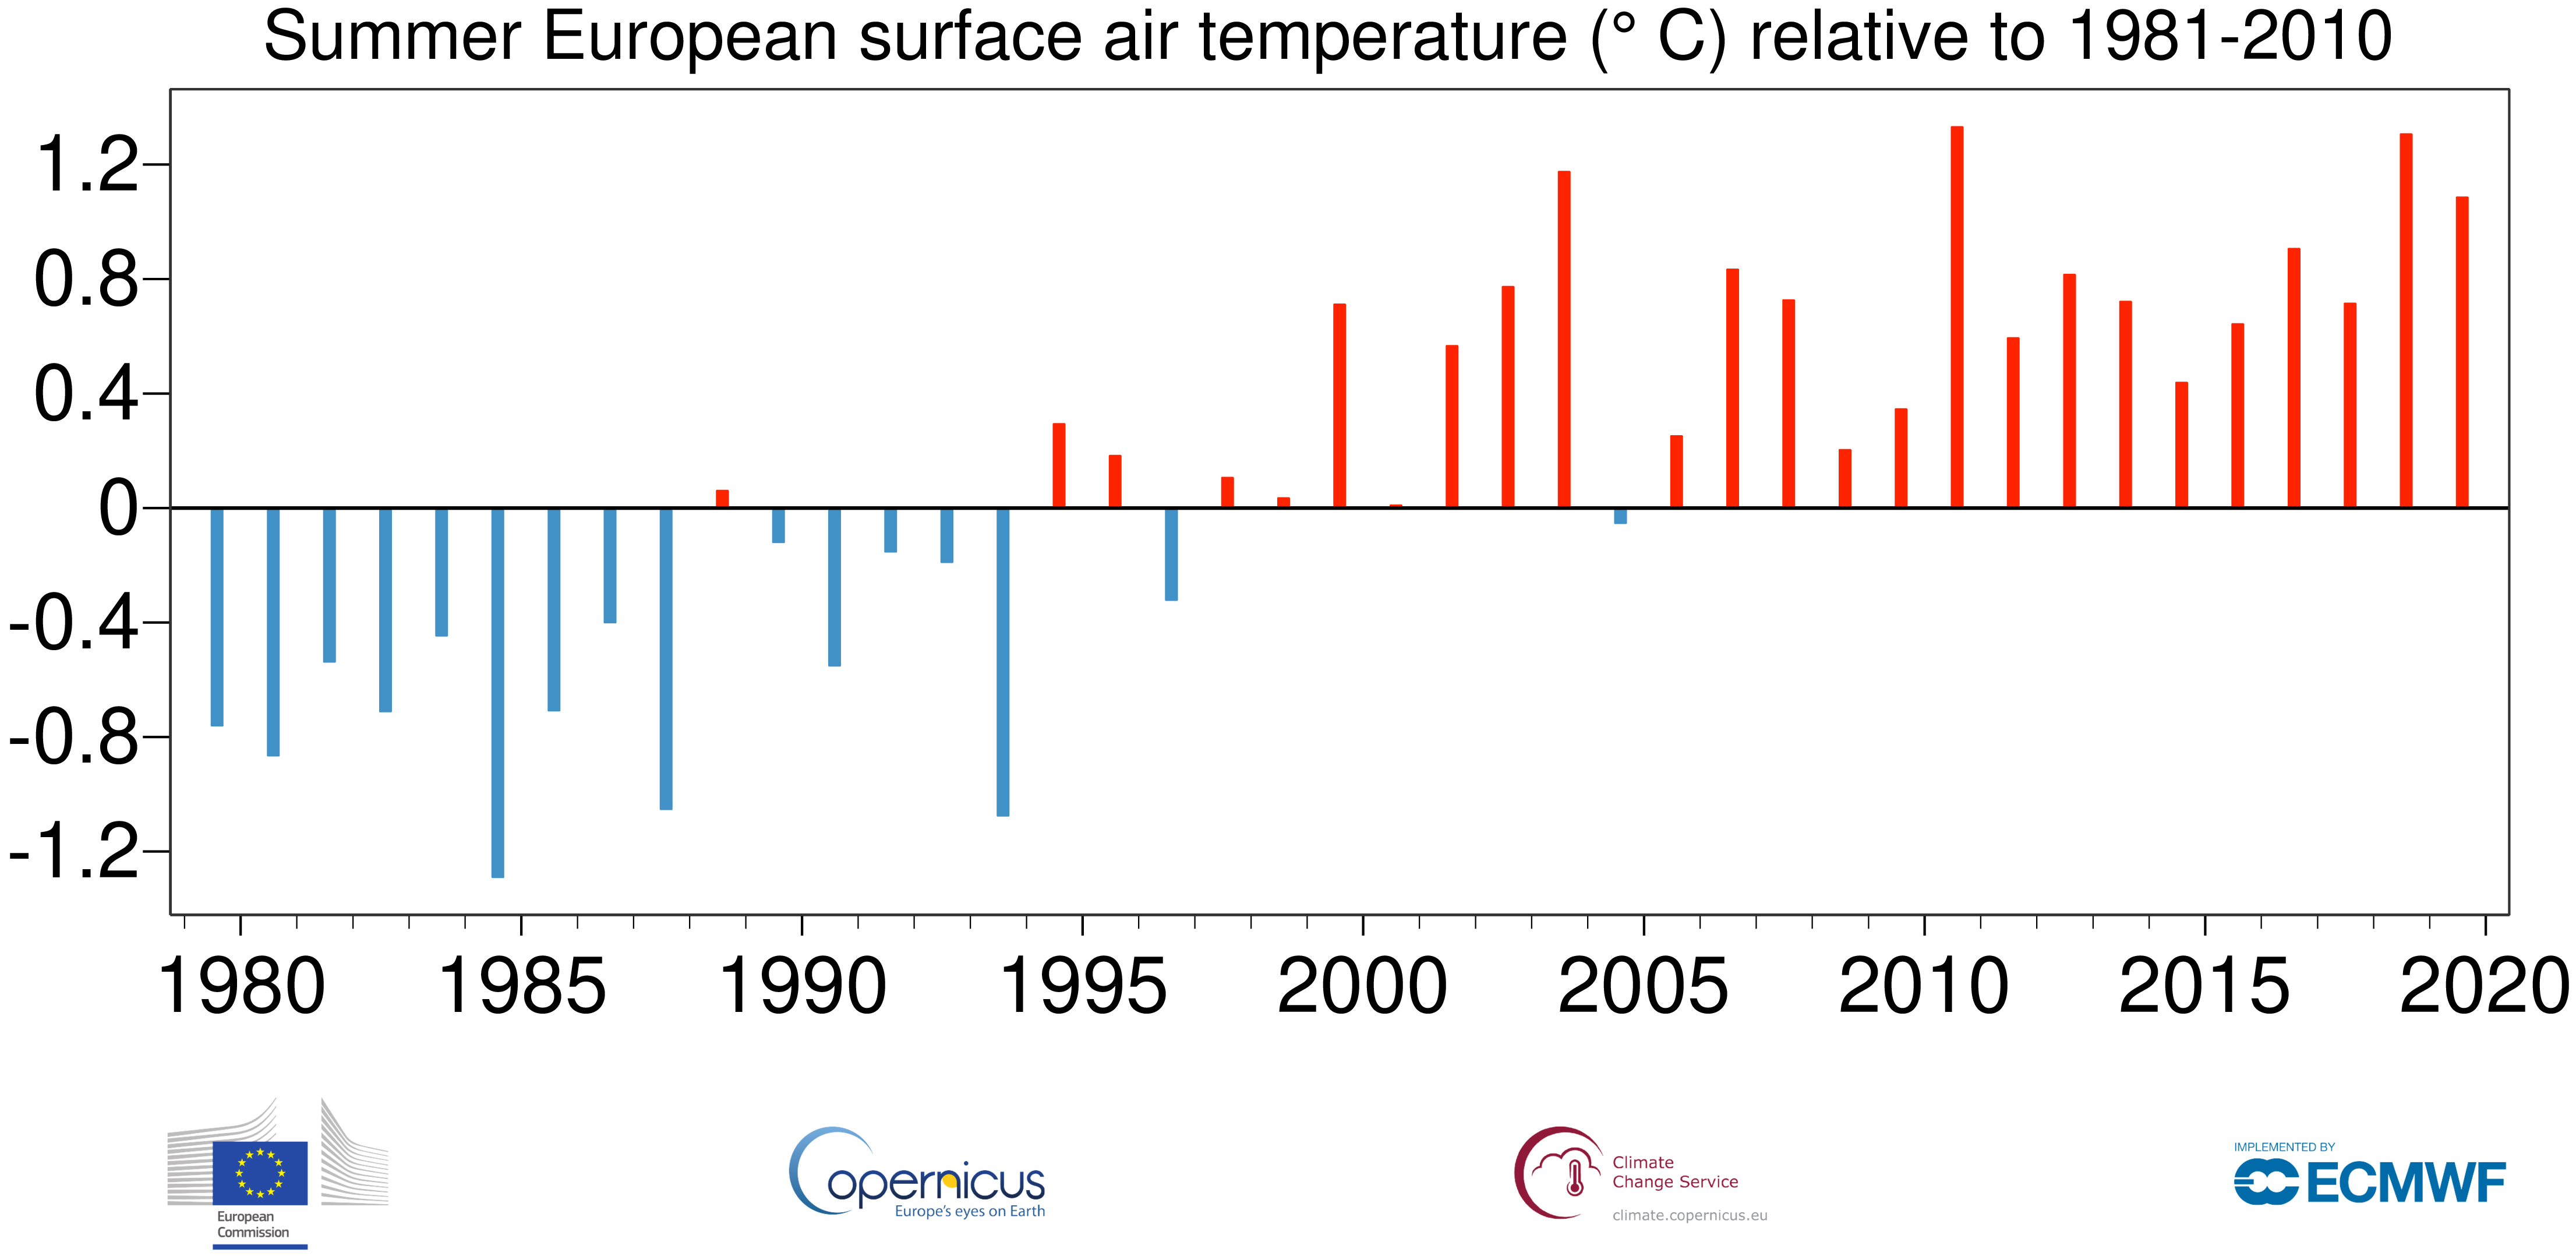
%3Cstrong%3E%20Two%20warm%20summers.%20%3C/strong%3E%20Across%20Europe,%20average%20temperatures%20this%20summer%20were%20the%20fourth%20warmest%20on%20record,%20while%20those%20in%202018%20were%20the%20second%20warmest,%20just%20behind%202010.%20The%20chart%20shows%20temperature%20anomalies%20compared%20to%20the%201981%E2%80%932010%20average,%20based%20on%20ERA5%20reanalysis%20data%20provided%20by%20the%20EU-funded%20Copernicus%20Climate%20Change%20Service%20implemented%20by%20ECMWF. Two warm summers. Across Europe, average temperatures this summer were the fourth warmest on record, while those in 2018 were the second warmest, just behind 2010. The chart shows temperature anomalies compared to the 1981–2010 average, based on ERA5 reanalysis data provided by the EU-funded Copernicus Climate Change Service implemented by ECMWF.
For the first episode, we focus on 26–28 June and for the second on 23–25 July. The two episodes had a similar geographical structure, apart from the fact that the July heatwave extended further to the north, including the British Isles, as seen in the panels showing predictions of the Extreme Forecast Index (EFI) for average temperature 1–3 days ahead. Regarding medium-range predictability, the geographical extent of both episodes was well captured a week in advance, as illustrated in the panels showing EFI predictions 7–9 days ahead.
%3Cstrong%3E%20Two-peak%20temperature%20structure%20in%202019.%20%3C/strong%3E%20The%20summer%20of%202019%20in%20western-central%20Europe%20was%20marked%20by%20two%20short%20episodes%20of%20extreme%20heat,%20as%20shown%20in%20this%20chart%20of%20daily%20mean%202%E2%80%91metre%20temperature%20from%20ECMWF%20analyses%20in%20a%20box%20covering%20some%20of%20the%20area%20(44%C2%B0N%E2%80%9350%C2%B0N%20and%202%C2%B0E%E2%80%938%C2%B0E)%20from%201%C2%A0May%20to%201%C2%A0September%C2%A02019. Two-peak temperature structure in 2019. The summer of 2019 in western-central Europe was marked by two short episodes of extreme heat, as shown in this chart of daily mean 2‑metre temperature from ECMWF analyses in a box covering some of the area (44°N–50°N and 2°E–8°E) from 1 May to 1 September 2019.
In the medium range, the ensemble was more confident about the extreme heat for the first episode. Looking at the evolution of ensemble distributions for 3‑day average temperature in a 6x6 degree box over western-central Europe (44°N–50°N and 2°E–8°E), we find a very different evolution of predictions for the two heatwaves. For the July episode, a warm anomaly was present in forecasts issued as early as two weeks in advance. Later on, the ensemble distribution continued to smoothly shift to more and more extreme temperatures, but with a large ensemble spread.
%3Cstrong%3E%20Extreme%20Forecast%20Index%20(EFI)%20and%20Shift%20of%20Tails%20(SOT)%20forecasts.%20%3C/strong%3E%20The%20charts%20show%20the%20EFI%20(shading)%20and%20SOT%20(contours)%20for%20maximum%20temperature%20in%20forecasts%20from%2000%20UTC%20on%2026%C2%A0June%20for%2026%E2%80%9328%C2%A0June%20(top%20left);%20from%2000%C2%A0UTC%20on%2023%C2%A0July%20for%2023%E2%80%9325%C2%A0July%20(top%20right);%20from%2000%C2%A0UTC%20on%2020%C2%A0June%20for%2026%E2%80%9328%C2%A0June%20(bottom%20left);%20and%20from%2000%C2%A0UTC%20on%2017%C2%A0July%20for%2023%E2%80%9325%C2%A0July%20(bottom%20right).%20The%20white%20square%20in%20the%20top%E2%80%91left%20panel%20shows%20the%20area%20of%2044%C2%B0N%E2%80%9350%C2%B0N%20and%202%C2%B0E%E2%80%938%C2%B0E%20referred%20to%20in%20the%20text. Extreme Forecast Index (EFI) and Shift of Tails (SOT) forecasts. The charts show the EFI (shading) and SOT (contours) for maximum temperature in forecasts from 00 UTC on 26 June for 26–28 June (top left); from 00 UTC on 23 July for 23–25 July (top right); from 00 UTC on 20 June for 26–28 June (bottom left); and from 00 UTC on 17 July for 23–25 July (bottom right). The white square in the top‑left panel shows the area of 44°N–50°N and 2°E–8°E referred to in the text.
For the June episode, 10–15 days before the event most ensemble members actually predicted a cold anomaly. The last cold forecast was issued 8 days before the start of the verifying period. However, the forecast drastically changed between 18 and 19 June, with the latter one clearly predicting the heatwave. We have therefore tried to trace the difference between these ensemble forecasts to the beginning of the forecast range. We found a short-range (2‑day) forecast difference concerning an eastwardly propagating Rossby wave packet west of the Rocky Mountains. In the coming days, the difference amplified over North America and the Atlantic, with an underestimation of the wave amplitude in the forecast from 18 June. Finally, this forecast missed the wave-breaking over the eastern Atlantic and the resulting cut-off low east of the Iberian Peninsula, which pushed the heat northward over western Europe. On average, the presence of Rossby wave packets helps to enhance predictability, but occasionally they are responsible for error propagation, as in this case.
%3Cstrong%3E%20Ensemble%20temperature%20forecasts.%20%3C/strong%3E%20The%20charts%20show%20the%20evolution%20of%20forecasts%20for%203-day%20average%202-metre%20temperature%20in%20western-central%20Europe%20(44%C2%B0N%E2%80%9350%C2%B0N%20and%202%C2%B0E%E2%80%938%C2%B0E)%20valid%20on%2026%E2%80%9328%20June%20(left)%20and%2023-25%20July%20(right).%20The%20blue%20box-and-whisker%20symbols%20show%20ensemble%20forecasts%20for%20different%20starting%20dates.%20The%20red%20dots%20indicate%20ECMWF%E2%80%99s%20deterministic%20high-resolution%20forecasts%20(HRES). Ensemble temperature forecasts. The charts show the evolution of forecasts for 3-day average 2-metre temperature in western-central Europe (44°N–50°N and 2°E–8°E) valid on 26–28 June (left) and 23-25 July (right). The blue box-and-whisker symbols show ensemble forecasts for different starting dates. The red dots indicate ECMWF’s deterministic high-resolution forecasts (HRES).
Overall, both episodes were relatively well predicted, with a warm signal early on, especially in forecasts of the July event, and a relatively rapid and consistent convergence on the analysed average temperature, especially in forecasts of the June event.