Between 28 October and 4 November 2024, a prolonged period of intense rainfall affected Spain's Mediterranean and adjacent provinces. On 29 October, the rainfall led to flash floods and river flooding, resulting in devastating impacts in the province of Valencia and, to a lesser extent, in other surrounding regions (Albacete, Cuenca and Málaga). At least 232 people lost their lives. Infrastructure damage and economic losses were severe, totalling around €16.5 billion.
Extreme rainfall and flooding
The weather system associated with this event was a cut-off low-pressure system, sometimes referred to in Spanish as a ‘dana’ (‘depresión aislada en niveles altos’). Warm, moist air from the Mediterranean Sea was pushed toward the Spanish coast, creating powerful convective structures. A detailed description of the event, including the storm structure, chronology, observed rainfall and historical context, is available in Spanish from the Spanish national meteorological service, AEMET (https://tinyurl.com/5y7wtfty). Further information is provided in ECMWF’s severe event catalogue (https://tinyurl.com/yfwxn488). The storms persisted for several hours over the same area. As a result, during this event, the national records for total rainfall in one (184.6 mm), six (620.6 mm) and twelve hours (720.4 mm) were all broken. The 1-hour rainfall total of 184.6 mm is three times AEMET’s threshold defining ‘torrential rain’, which is 60 mm. On 29 October, 771.8 mm of rain in 24 hours was seen at Turís Mas de Calabarra. This is the second highest 24‑hour rainfall total on record for Spain, after 817.0 mm observed in Oliva (Valencia) during a similar event in 1987.
The most impacted areas were located immediately south of the city of Valencia, specifically the Horta Sud region (including Paiporta). Although they received relatively little direct precipitation, their location downstream and downhill of the aforementioned extreme totals was critical, with the seasonal river Rambla del Poyo and its small catchment playing a key role in flooding. Many sections of the rivers Turia, Jucar, Cabriel and Magro, which have much larger catchments, also flooded as waves of water moved quickly downhill towards coastal towns.
Extreme precipitation forecast
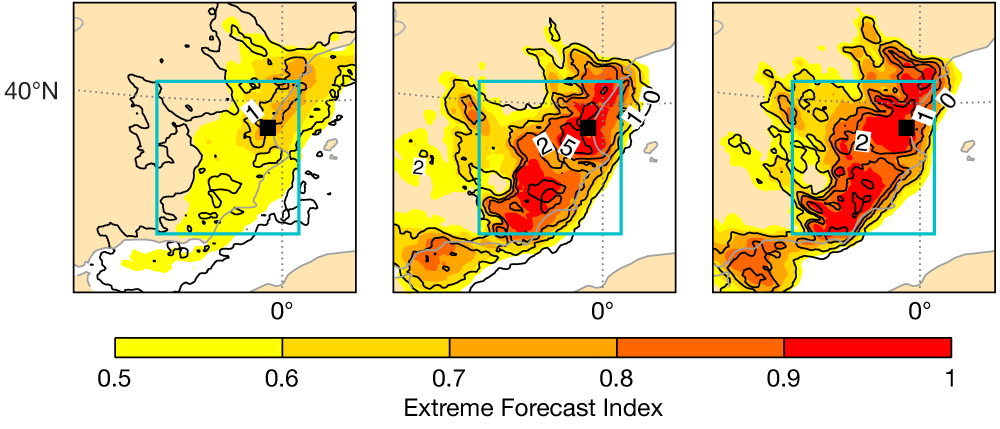
ECMWF’s Extreme Forecast Index (EFI) for 24‑hour precipitation indicated a strong signal for a rare precipitation event over the Mediterranean regions of Spain, appearing as early as six days in advance, with values ranging between 0.7 and 0.8. By four days prior to the event, EFI values neared 1, suggesting an increasing confidence in an extreme precipitation scenario. This high predictability was due to the accurate representation of the cut‑off low location in the forecast several days in advance. While some uncertainty remained in the exact spatial distribution of the anomalous weather at lead times of 5–6 days, forecast consistency improved significantly from day 4 onward. From that time, the Integrated Forecasting System ensemble prediction system (IFS ENS) maintained a stable spatial representation of the expected precipitation patterns. Shift of Tails (SOT) values, which provide information about how extreme an event could potentially be, exceeded 5, particularly for Valencia province in the forecast issued on 26 October, with a three-day lead time. By the forecast issued on 28 October (one day before the event), the high SOT values were widely spread across neighbouring regions.

A comparison between the 48 h IFS ensemble control forecast and the Harmonie-Arome regional model from AEMET valid for 24 h precipitation accumulations on 29 October reveals significant differences in both intensity and spatial distribution of the precipitation. The Harmonie-Arome model, with its higher horizontal grid spacing (2.5 km), predicted stronger precipitation intensities near the affected areas than the IFS ensemble control with a grid spacing of 9 km. The regional model simulated maximum 24‑hour accumulations of 175–250 mm, while the global IFS forecast produced maximum values in the range of 150–200 mm. However, high-density observational datasets from AEMET reveal a notable underestimation of the predicted precipitation maxima in both models, with actual observations indicating clearly a sizeable region (about 15 km by 15 km) with accumulations between 500 and 800 mm, which neither forecast system successfully captured.

In terms of spatial distribution, the IFS ensemble control exhibited limited inland propagation of precipitation from the coastal areas along the prevailing southeast-to-northwest wind direction. In contrast, Harmonie-Arome reproduced this progression more realistically but positioned the convection initiation and peak precipitation too far inland.
Understanding model errors
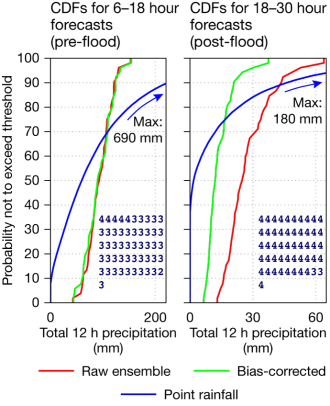
Whilst underprediction of extreme rainfall totals at grid scale has been seen before, high observation density makes this case unusually clearcut. Nonetheless, underprediction is atypical; on average the IFS overpredicts slightly. Therefore, different weather situations may have different forecast biases. ECMWF’s ecPoint rainfall post-processing framework can provide further insights because, as well as anticipating sub-grid variability (blue lines on the cumulative distribution function figure panels), situation-dependent (grid scale) bias correction is also incorporated (green lines).

The relationship between raw IFS (red) and bias-corrected (green) differs between the two forecasting periods. On the left, raw output hardly changed, whilst on the right raw totals were reduced by about 50%. A physical interpretation can be made using ‘weather types’. These are indices used for post-processing, that denote the ongoing meteorological situation in each member. On the left these mostly showed 50–75% of rainfall to be convective (3s in the table of numbers), but high Convective Available Potential Energy (not shown), which together suggest active convection that the IFS is trying to upscale. On the right, convective rainfall prevails (4s for >75% fraction) and mid-level winds are strong, suggesting local over-prediction, in turn because parametrized convection does not move in the IFS. So, in the later period the chances of under-prediction in the raw IFS output were much smaller.
Meanwhile, using ecPoint calibration software offline, with millions of cases, we built on the above and identified another issue that could allow for further ecPoint and/or model physics refinements, to elevate rainfall total forecasts for this type of case. Most notably, biases also relate strongly to IFS near-surface relative humidity: high values, seen in this case, can link to underprediction, and vice-versa. Thus, from a model physics perspective droplet evaporation and warm-rain processes could be useful targets. The characteristics of Arome are expected to be rather different.
Conclusion
The synoptic-scale predictability of the event was remarkably high, with signs of unusual and extreme weather well captured by the IFS ensemble forecast. However, current operational numerical weather prediction systems still have limitations and did not accurately predict either the maximum precipitation accumulation or its location, likely due to resolution constraints, simplifications in model physics, and challenges in representing convective-scale processes. Future improvements in high-resolution modelling, together with advances in model physics and suitable post-processing techniques will be essential to enhance the precision of extreme precipitation predictions in such high-impact events.
