A recent study has looked at the implications of changing the number of members in ensemble forecasting from two different perspectives: that of forecast users and that of scientists developing a numerical weather prediction (NWP) system. It found that users could benefit from increases in ensemble size even beyond the ensemble size of 50 used operationally at ECMWF, while scientists could become more productive by using ensembles with fewer than 10 members. However, the scientists’ development work needs to be designed carefully to enable conclusions that are relevant for large ensemble sizes. The key elements for meaningful development work with few members are the use of ‘fair scores’ and an ensemble generation methodology that provides exchangeable members.
The users’ perspective
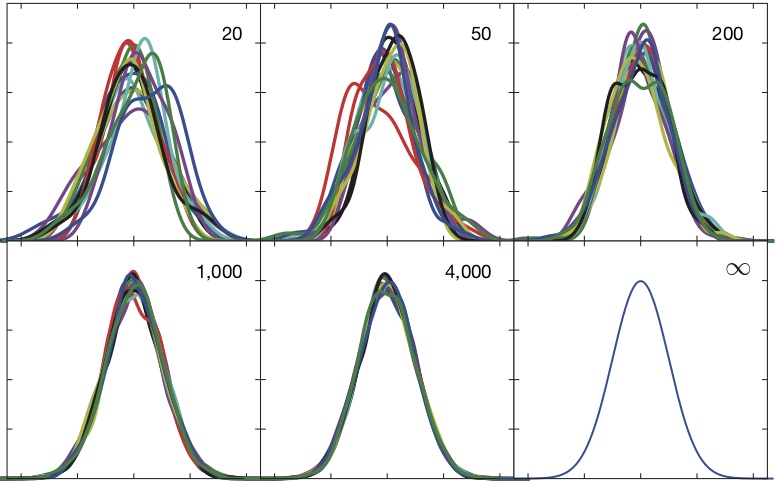
Probabilistic forecasts are based on ensembles, and the number of members determines among other things how well a probability distribution can be estimated. The figure illustrates this for a simulated situation where ensembles of various sizes were obtained by repeatedly sampling members from a known distribution. Probability densities based on the different ensembles were estimated and plotted for each ensemble size. The differences among the realisations illustrate the magnitude of the sampling uncertainties that are to be expected for a range of ensemble sizes. They are not negligible for ensemble sizes used in operational weather forecasting.
The sensitivity of forecast quality to ensemble size varies depending on which verification metrics are considered. A number of scores converge with ensemble size M as 1 + 1/M to the score of an ensemble with an infinite number of members, provided the ensemble is reliable. An example is the continuous ranked probability score (CRPS), which is zero for a perfect deterministic forecast. Even if perfect reliability cannot be assumed, the convergence holds reasonably well, as results with the ECMWF ensemble for upper-air variables in the extratropics demonstrate for ensembles with up to 200 members. The convergence result implies that changing the ensemble size from M1 to M2 changes the score by 100 (M1 – M2)/M2(M1 + 1) per cent. Thus, skill measured with the CRPS would increase (decrease) by 1% (3%) if the ensemble size changed from 50 to 100 (20). For a score that measures the skill of quantiles in the tail of the distribution, the sensitivity to ensemble size is considerably larger. This is particularly relevant for users who make decisions for low cost-loss ratios.
The scientists’ perspective
For research and development, testing with a large ensemble size is a burden. The larger the ensemble, the longer scientists have to wait for the results to be generated, which means that progress will be slower. However, for some of the most relevant scores it is possible to make statistical corrections, which adjust the value of the score obtained from a small ensemble to the value of the score of a large ensemble or the underlying distribution even if the ensemble is not reliable. In a situation where ensemble members are exchangeable, it can be proven that the expected value of the adjusted score is identical to the score that would be obtained with infinite ensemble size. Ensemble scores that have been adjusted in this way are also referred to as fair scores. The study documents how well changes in fair scores computed with ensembles with as few as 2 to 8 members can predict the change in CRPS for the operational ensemble size of 50 members. These results could help to accelerate progress in NWP under the constraint of limited computing resources.
Further information can be found in an article published by Martin Leutbecher in the Quarterly Journal of the Royal Meteorological Society doi:10.1002/qj.3387.