The late spring and summer of 2018 were among the warmest on record for northern Europe. ECMWF extended-range forecasts predicted warm anomalies weeks in advance, but the northerly extent and intraseasonal variability of the heatwave were only reflected in forecasts up to two weeks ahead.
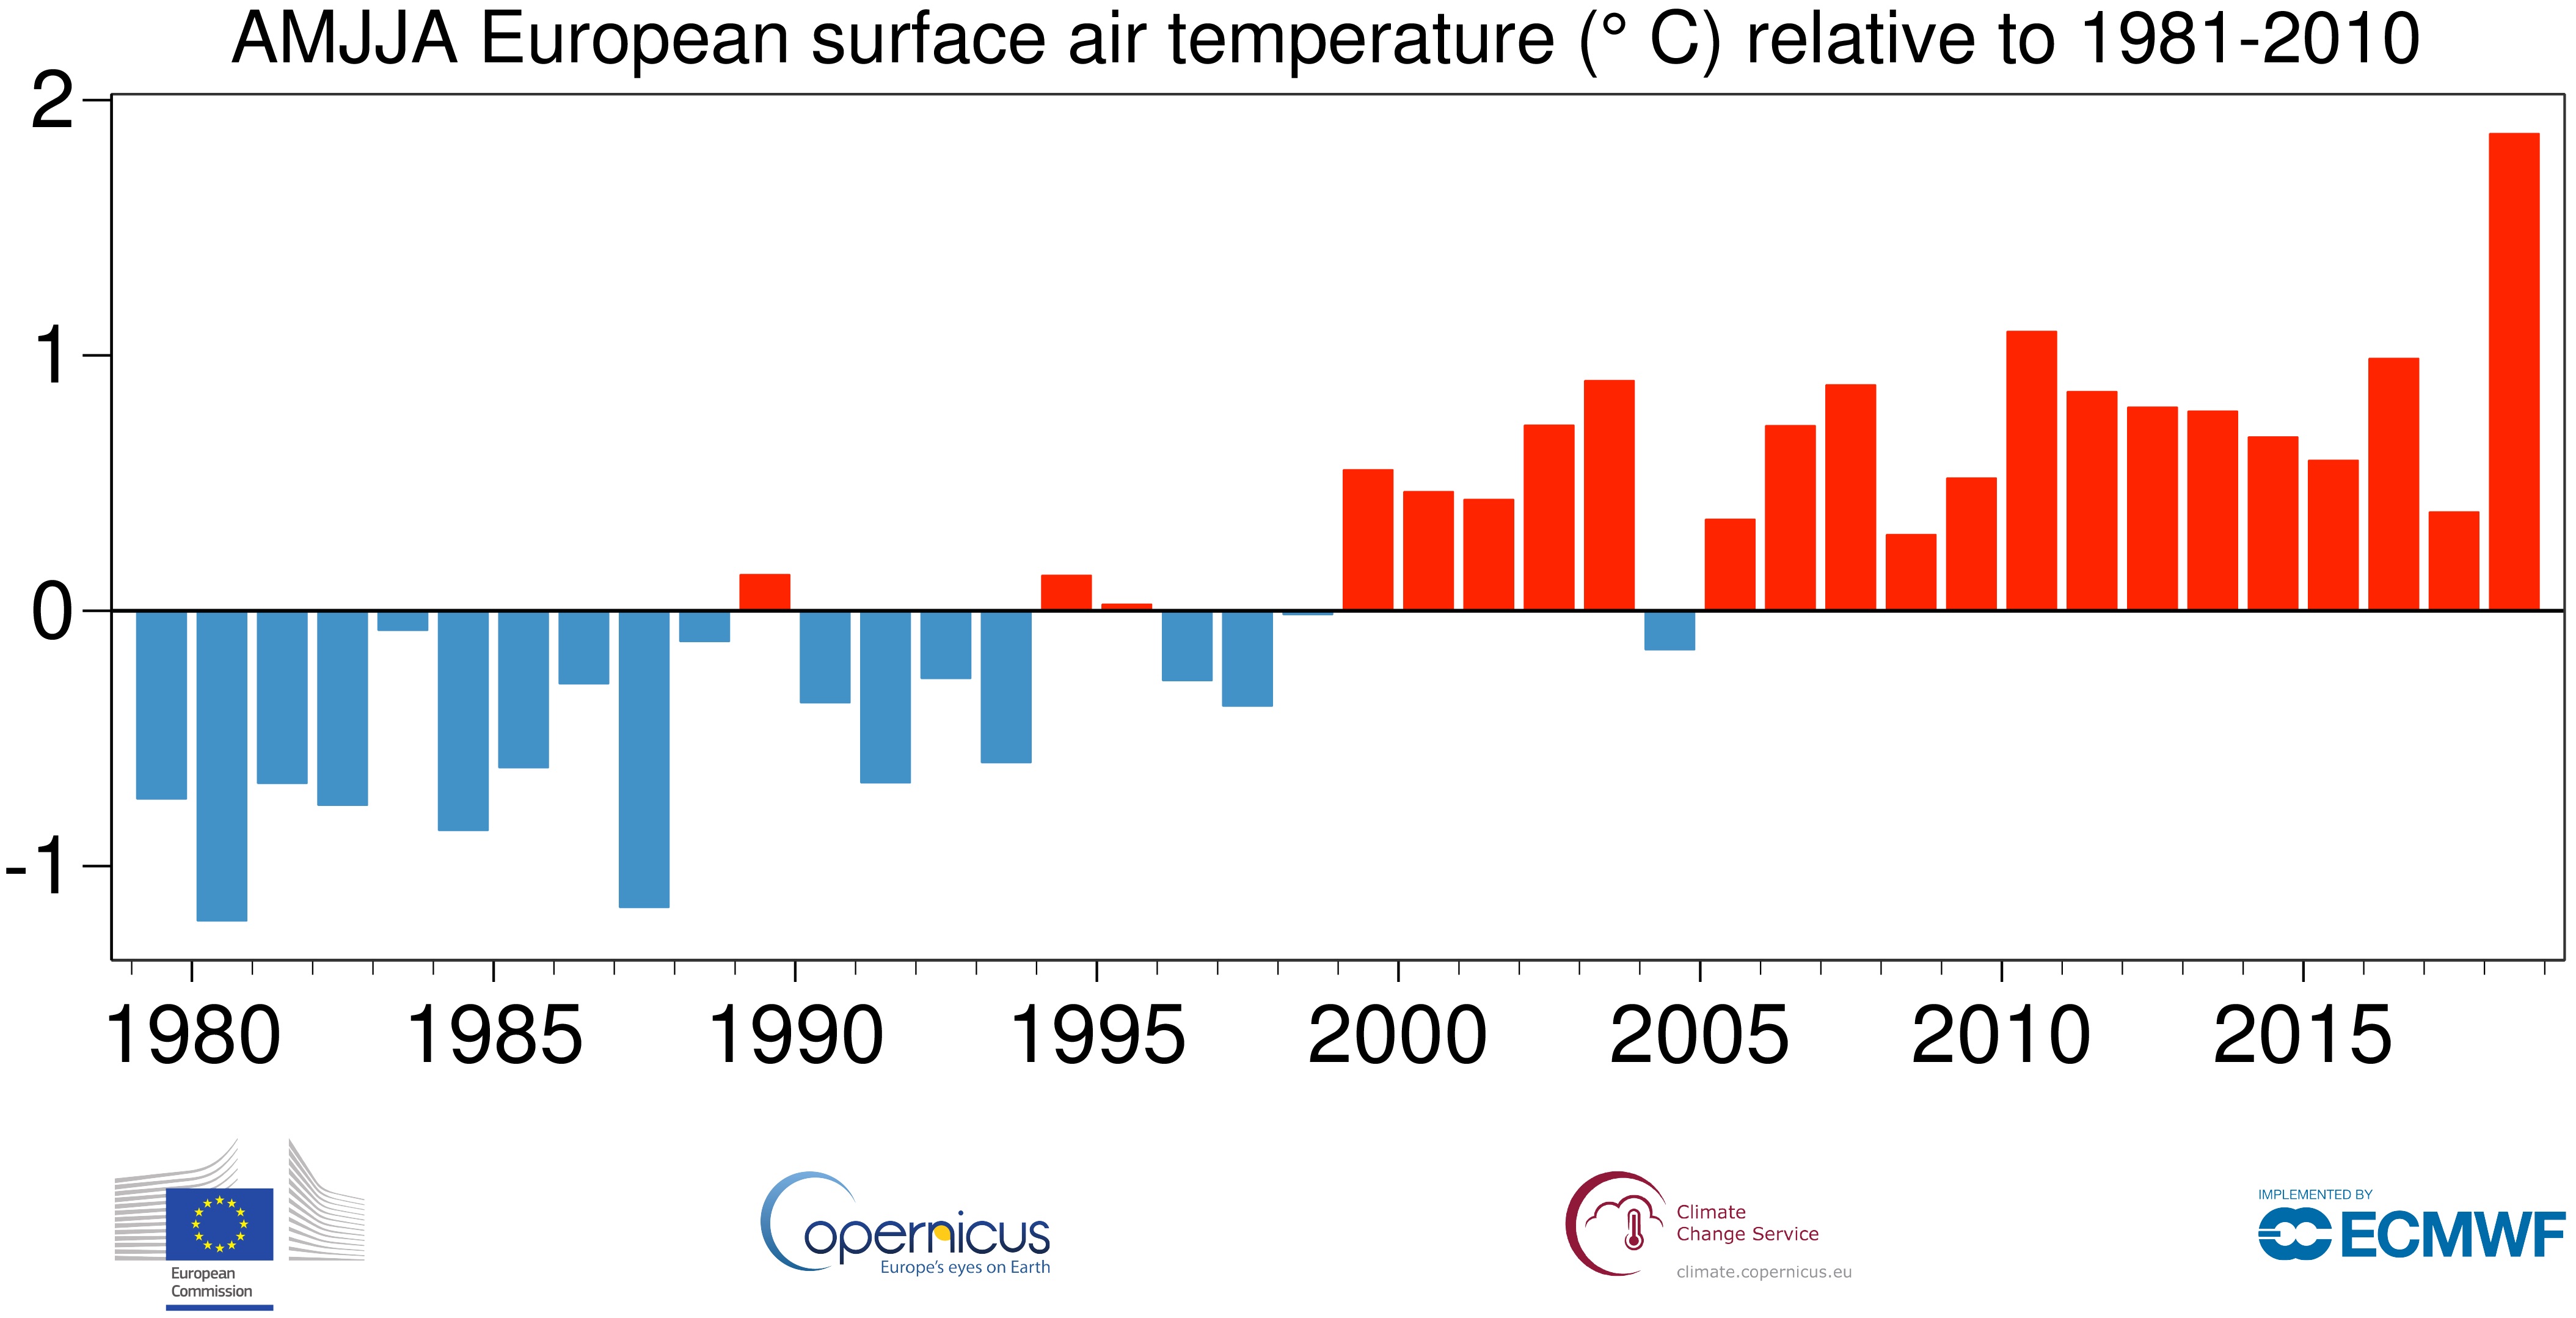
A chart produced by the Copernicus Climate Change Service (C3S) implemented by ECMWF shows that the near-surface air temperature anomaly in Europe for the period April to August 2018 was far larger than in any previous year since 1979. The strongest anomalies occurred in the Baltic Sea region, while the countries around the Mediterranean experienced close to normal temperatures on average. The heatwave can be divided into three parts: the second half of April, mid-May to mid-June, and the second half of July to the beginning of August, with more normal temperatures in between. While southern Europe had more normal temperatures on average, south-western Europe experienced a surge of heat at the beginning of August, with temperatures reaching 45°C in Spain and Portugal on 4 August.
With these temporal and spatial variations, there are many aspects to verify in ECMWF’s forecasts, and not all can be covered here. Focusing on the two main parts of the heatwave, as a first verification we use composites of weekly anomalies from extended-range forecasts covering the period 7 May to 12 August at different lead times (one week, two weeks, three weeks and four weeks). For example, the composite of week-one forecasts issued on Mondays uses forecast days 0 to 7, the composite of week-two forecasts uses forecast days 8 to 14, etc. The predicted anomalies in week-one and week-two forecasts resemble the spatial pattern of the anomalies in the analysis well. Warm anomalies are also present in the week-three and week-four forecasts, but they are weaker and the forecasts did not reflect their northerly extent. It is worth mentioning that, even at the longest time ranges, the cold anomaly over north-eastern Canada and the central-northern Atlantic was captured.

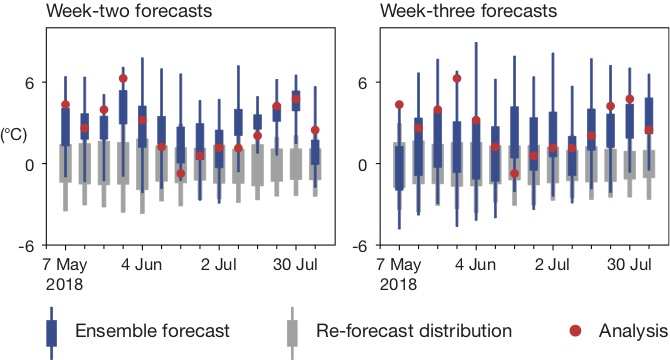
The results from this evaluation show that the extended-range forecasts predicted the warm anomaly fairly well on average, but they do not tell us how well the intra-seasonal variability was captured. We have therefore also visualised the week-by-week evolution of 2-metre temperature anomalies averaged over a region in northern Europe (50°N–60°N, 10°E–20°E) in week-two and week-three forecasts, the analysis (used for verification) and the model climate (re-forecast distribution). By definition, the anomalies in the re-forecasts are centred around zero. The plots show that week-two forecasts captured the intra-seasonal variations seen in the analysis reasonably well. Week-three forecasts, on the other hand, showed less variation in the predicted anomalies throughout the summer. They failed to give any indication of the warm peak at the end of May or of the break in the warm weather at the end of June, although they gave some indication of the warm period in the second half of July.
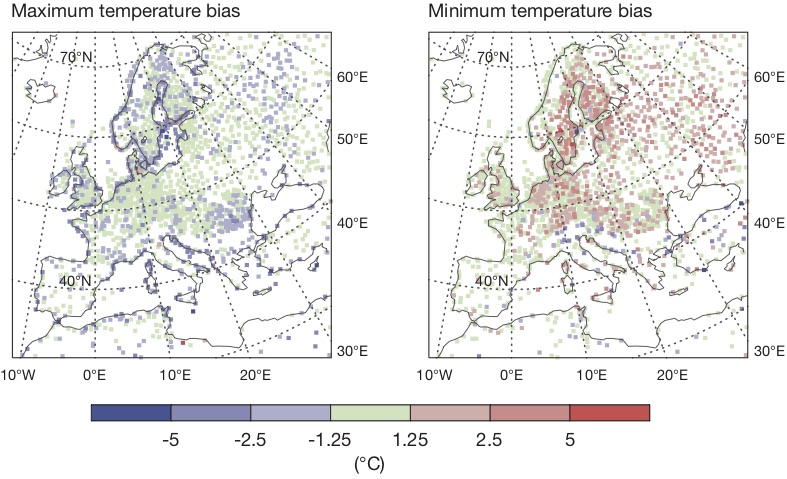
In short-range forecasts, when averaging over the period 7 May to 12 August 2018, a general tendency can be detected across Europe for daily maximum temperatures to have been underestimated and minimum temperatures to have been overestimated. The underestimation of the diurnal cycle in heatwave conditions is one of the topics being explored in ECMWF’s USURF project. For more details on USURF, see the article on biases in near-surface forecasts in this Newsletter.
The European heatwave of 2018 poses questions about the driving mechanisms behind the strong anomalies. Evaluating the predictability of heatwaves is part of ECMWF’s activities in the subseasonal-to-seasonal (S2S) project sponsored by the World Weather Research Programme (WWRP) and the World Climate Research Programme (WCRP). It will also be part of the newly approved EU-funded Horizon 2020 CAFE project, which starts in 2019 and in which ECMWF is a partner.