
Cyclone Filomena affected Spain from 6 January 2021 with strong winds and heavy rain in the Canary Islands and southern Andalusia, and with extreme snowfall in large areas of the interior of the Iberian Peninsula on 8–9 January. The Madrid area saw snow accumulations up to 50 cm in 30 hours, which meant this was the most intense snowstorm since 1971. After Filomena disappeared, an extreme cold wave affected the whole Peninsula. This can also be considered historic due to minimum temperature records in many areas. The snow episode forced Madrid-Barajas Airport to close and led to a cancelling of the entire rail service in the region. Schools were also closed for several days.
The Spanish Meteorological Agency (AEMET) named the storm Filomena on 5 January, when its centre was close to the Azores Islands. On 8 January, Filomena moved in a northeast direction towards the south of the Iberian Peninsula as an extratropical storm structure (cold, warm, and occluded fronts). Meanwhile, a very cold polar airmass with minimums below 0°C was established over practically the entire Iberian Peninsula.
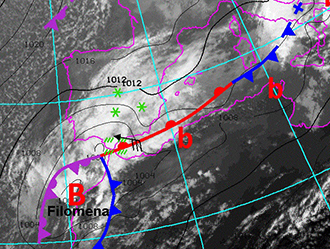
Therefore, when the storm Filomena reached the Peninsula, the warm and humid air moved over the very cold air below (see the AEMET chart). With the exception of some southern coastal areas, all precipitation occurred as snow during 8 and 9 January, resulting in a snow covering of the entire centre and northeast quadrant of the Peninsula after the storm. Red warnings were set up in most of those areas due to the high 24-hour precipitation accumulations expected in ECMWF’s ensemble forecast (ENS) for several consecutive model runs.
Snowfall accumulations
ECMWF’s high-resolution forecast (HRES) and the ENS over Madrid provided some indication of the risk of snowfall from the beginning of January. From 3 January 12 UTC, the ENS median indicated snowfall totals of 20–30 mm for the period 7–9 January, compared to around 10 mm in earlier forecasts. Even in earlier forecasts, a substantial number of ENS members were indicating large amounts of snow. However, a large spread in the medium range was observed due to the uncertainty regarding the exact location of the convergence between the polar and the subtropical air masses. The Extreme Forecast Index (EFI) was variable according to the changes in the ensemble forecast; however, a clear signal of a rare snowfall event was present six days in advance with EFI values between 0.7–0.8 in Madrid (see the EFI figure and the box-and-whiskers forecast for the area around Madrid). EFI values were close to 1 from four days in advance, with some uncertainty in the exact spatial distribution of the anomalous weather. The averaged 72-hour observed precipitation up to 10 January 00 UTC among 11 stations inside a 1x1 degree box ranged from 5 to 53 mm, showing huge variability in the snowfall distribution. This compares with more than 60 mm predicted in the south of the box and between 10 and 20 mm in the north by the corresponding HRES forecast starting on 5 January 00 UTC (see the figure on observations and the HRES forecast). The same forecast on 6 January showed generally larger precipitation amounts in the southeast of Spain. However, a considerable decrease in the predicted precipitation amount was observed again at the shortest lead time on the 7 January 00 UTC run, mainly due to uncertainty in the trajectory of the cyclone between consecutive model runs. We should point out that there is also a large uncertainty in the observations, since the SYNOP stations in Spain cannot measure snowfall correctly due to the lack of heating of rain gauges. Therefore, we expect the observed precipitation to be underestimated, which makes this analysis just an estimation.

Very cold conditions after Filomena
When the North Atlantic Oscillation (NAO) enters a negative phase, it usually has a large impact on the Iberian Peninsula. In this phase, the high-level jet stream drifts to lower latitudes, resulting in above-normal rainfall and lower temperatures in southern Europe. From the end of 2020, global models began to forecast a possible negative NAO in early 2021, and this situation may have contributed to create wet and cold conditions in almost the whole Iberian Peninsula during Filomena. After Filomena, many areas in northeast Spain dropped to record low temperatures for several consecutive days. Temperatures from -20 to –26°C were recorded in some areas with anticyclonic conditions. The figure showing the temperature anomaly forecast in Europe up to two weeks ahead indicates that the low temperatures were part of a larger phenomenon. Madrid registered a minimum of –6°C on 12 January. The mean 72-hour temperature forecast up to 10 January 00 UTC inside a 1x1 degree box suggests a tendency of the temperature dropping for those days from the beginning of January. In forecasts from 9 to 10 January, the ENS median indicated mean temperature values inside that box near –5°C. However, the forecasts issued on 10 January for the same day increased those values to around –2°C and reduced the forecast’s uncertainty. We can also systematically observe higher temperatures in the HRES than in the ENS Control for different lead times of the event (see the temperature forecast for the Madrid region). An evaluation of the model performance shows that temperatures were generally overestimated in many areas of the interior of the Peninsula. This may have been caused by some disagreements between snow coverage in the forecast and according to observations.


Overall, the IFS successfully predicted this historic snowfall event well in advance. The forecasts included the normal uncertainties associated with the exact location of the polar and subtropical air mass convergence and the total amount and extension of the most affected areas, but they contained enough information to provide the corresponding weather warnings long in advance.
