The Copernicus Climate Data Store (CDS) has recently been extended with the introduction of new global climate projection data from CMIP6 and regional simulations from CORDEX. The CDS is the main user interface of the Copernicus Climate Change Service (C3S) implemented by ECMWF on behalf of the EU. The recently published data is a key input to the Sixth Assessment Report of the Intergovernmental Panel on Climate Change (IPCC).
Nature and origin of the data
Climate projections come from global and regional climate models and provide information about the future evolution of the planet’s climate system at global and local scales. This quantitative information about climate change is highly relevant for developing adaptation strategies for the future and thus an important component of the catalogue of C3S datasets.
The climate projections in the CDS (https://cds.climate.copernicus.eu) are subsets of data generated under international climate model intercomparison activities, like CMIP (Coupled Model Intercomparison Project) for global projections and CORDEX (Coordinated Regional Climate Downscaling Experiment) for regional projections. The CMIP and CORDEX projects design the intercomparison experiments and collect global/regional climate projection information from climate modelling centres all over the world. These datasets are archived at the Earth System Grid Federation (ESGF), a federated infrastructure maintained by and primarily aimed at research institutions. C3S relies on the ESGF datasets but makes them more appropriate for climate service applications, by creating a robust and resilient system, which ensures continuous availability and includes additional quality control on the data.
Data service
The publication of CMIP6 data in the CDS is an important milestone, providing users of C3S with very new, state-of-the-art global climate projection data, which will be intensively used and referred to in the coming years. The main features of the dataset can be summarised as follows:
- Historical simulations (validation runs for the past) and scenario simulations (future projections) are available. Simulations under a number of scenarios are available (see the CDS dataset documentation).
- Around 50 variables from more than 50 different Global Climate Models (GCMs) will be available. These are represented on single levels (typically surface, but also top of the atmosphere) or pressure levels (between 1,000 hPa and 1 hPa).
- The data are available at monthly and daily temporal resolution.
- Computational processes will be on offer in this catalogue entry with subsetting options already included in the interface. This is a new feature of the CDS catalogue, which exploits processing services run at the location of the data, thus making it unnecessary for users to download large datasets. Sub-setting can be done in the vertical direction (choice of pressure levels or surface), horizontally (geographic selection), or in time (selection of the time period required).
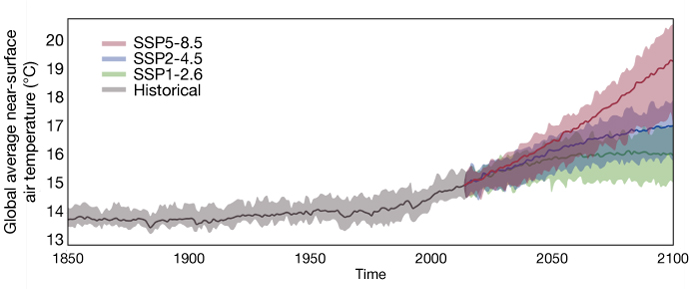
- Easy data manipulation and visualisation in the CDS. For example, the figure was created by a simple workflow in the CDS Toolbox.

C3S implicitly supports the IPCC assessment through its contribution to the IPCC interactive climate atlas. This is a tool to visualise and assess different global and regional climate projections and will complement the IPCC AR6 report. C3S has provided support to upload many CORDEX simulations for regions outside Europe to ESGF, and to quality-control European and non-European climate projection data for the regions designated by CORDEX. For Europe, C3S has also significantly enhanced the number of high-resolution simulations, to better sample uncertainties coming from the global and regional models, scenarios and internal climate variability, and published these in the CDS. Data covering other CORDEX domains around the world is now available to users of the CDS, with the Mediterranean, North American, Arctic, African and South American regions recently published, and more domains to come soon.
Outlook
By the end of 2022, the IPCC will release its assessment report based on CMIP6 model simulations. Interest in these climate projections already is and will remain high, in the context of climate services and thus among users of the CDS. We anticipate the number of users accessing CMIP6 data to far exceed the more than 1,000 who have made use of the CMIP5 CDS data in the last two years. In the next phase of the Copernicus programme, C3S will add more global and regional projection data from CMIP6 and its regionally downscaled simulations to the CDS. Better tools and applications are also in the pipeline for the CDS infrastructure to enhance the value of climate projections to users.

