Extended-range forecasts in ECMWF’s Integrated Forecasting System (IFS), which are predictions beyond two weeks but less than a season, became operational in October 2004 to fill the gap between medium-range and seasonal forecasting. Originally, they were produced by running coupled ocean–atmosphere integrations up to day 32 at a TL159 horizontal resolution (about 110 km) every Wednesday at 00 UTC. At that time, the extended-range forecasting system was run separately from the medium-range and seasonal forecasting systems. Since 2004, the configuration of the ECMWF extended-range forecasting system has changed several times. A particularly important change took place in 2008, when the medium-range and extended-range forecasting systems were merged. Extended-range forecasts were then produced by extending medium-range forecasts up to day 32, at a lower atmospheric horizontal resolution beyond day 15. In 2011, the frequency of extended-range real-time forecasts was increased to twice a week, and in 2015 the forecast length was increased from 32 to 46 days. Since 2004, the model resolution of extended-range forecasts has also increased, from about 100 km to about 36 km and from 40 to 137 vertical levels. The current configuration of real-time extended-range forecasts is the following:
- 46‑day integrations
- Every Monday and Thursday at 00 UTC
- 51‑member ensemble
- Tco639 resolution (about 18 km) up to day 15 and Tco319 (about 36 km) after day 15
- 137 vertical levels.
Re-forecasts are used for calibration of real-time forecasts and for extended-range forecast skill assessment. In the current configuration, they are produced twice a week, starting the same day and month as the real-time forecasts, but for the past 20 years and with an 11‑member ensemble.
The availability of the new Atos high-performance computing facility in Bologna (Italy) provides an opportunity to enhance the ECMWF extended-range forecasting system further. The proposed changes, which will be introduced with IFS Cycle 48r1 in 2023, are the following:
- Daily instead of twice-weekly frequency
- 101 instead of 51 ensemble members
- Extended-range integrations will be run separately from higher-resolution medium-range forecasts
- Tco319 (about 36 km) horizontal resolution from day 0 to 46.
This configuration was supported by users, who expressed their feedback in a survey conducted in 2021. The enhancement in the extended-range configuration complements the strategy followed in the medium range, since it focuses on increasing the ensemble size and forecast frequency rather than increasing the model resolution. This article will discuss the main motivations behind these changes.
Increasing the frequency
Increasing the frequency of extended-range forecasts from twice weekly to daily will significantly improve the quality of extended-range forecasts for days of the week other than Monday and Thursday. For instance, the most recent extended-range forecast available on Sundays is already three days old. Figure 1 shows an example of the benefit of the increased frequency for the prediction of the Madden–Julian Oscillation (MJO) (see the blue line). It shows that, by running extended-range forecasts every day, the predictive skill of a forecast produced on Sunday is significantly higher than the predictive skill of a forecast which is three days old (current configuration). Therefore, the new configuration will provide more flexibility for users to access recently initiated extended-range forecasts.
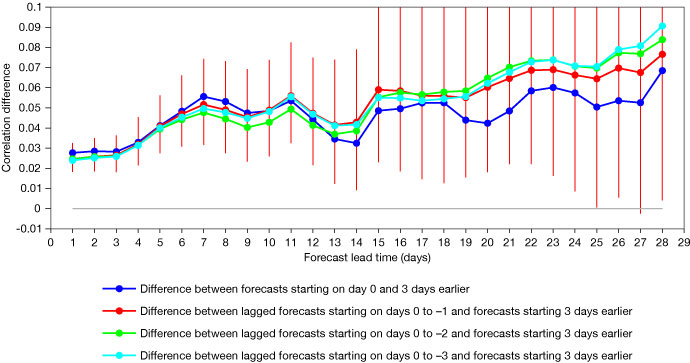
The daily frequency will also make it possible to create lagged ensembles, where the forecasts of previous days are combined with the most recent forecasts to produce a larger ensemble. The main benefit of a lagged ensemble is that it allows the creation of a much larger ensemble. This enables more skilful forecasts overall, despite the fact that the lagged ensemble includes less skilful ensemble members because they were initialised a few days earlier. However, a lagged ensemble is more difficult to calibrate because it mixes forecasts with different lead times. The benefit of this approach for extended-range forecasts has been documented in Vitart and Takaya (2021), which showed that combining the most recent extended-range forecast with older forecasts provides more skilful forecasts of weeks 2, 3 and 4 than extended-range forecasts produced only from the most recent ensemble. The optimal number of previous forecasts to combine depends on the lead time. For week 2 (days 12–18), the optimal benefits are obtained by combining just the most recent forecast with the forecast produced one day earlier, while for week‑4 forecasts, the optimal lagged-ensemble configuration includes forecasts produced up to three days earlier. Including even earlier forecasts would degrade the extended-range forecast skill, despite increasing the ensemble size. Figure 1 shows an example of the benefit of a lagged ensemble for the extended-range prediction of the MJO. According to Figure 1, the benefit of the lagged ensemble (red, green and cyan curves) increases with lead time. It starts to be visible only after about 10 days of forecasts and becomes substantial in weeks 3 and 4.
Better European weather regimes
Probabilities for Euro-Atlantic regimes have been issued for some time and are freely accessible (look for ‘Weather regime probabilities’ under ‘Extended-range charts’ in https://www.ecmwf.int/en/forecasts/charts). The conceptual model of regimes is useful to condense the forecast information in ensemble forecasting (Grams et al., 2020). By identifying the dominant regime of the day in each ensemble member, we can visualise how the probabilities of regime occurrence evolve in the next 46 days. For example, users can evaluate how long strong westerlies across the Atlantic are likely to persist, or whether a transition into a different flow configuration is more likely to occur. The prediction of persistence and transition from one regime to another can be a challenge (e.g. Ferranti et al., 2015; Grams et al., 2018). On the other hand, because regime occurrence is affected by tropical heat anomalies and by fluctuations of the stratospheric polar vortex, regime predictability in the extended range can rise when such external forcings are in action. It is the sensitivity to these external forcings that makes the regimes ideal targets for extended-range predictions. Since weather regimes are linked to surface weather and weather extremes, through regime probabilities we can also infer the risk of cold spells in winter, heatwaves in summer, and widespread heavy precipitation or thunderstorm activity (e.g. Ferranti et al., 2018).
With the upgrade to Cycle 48r1, extended-range ensemble forecasts will be running daily rather than twice a week. We have evaluated the effect of this increase in forecast frequency on regime predictive skill.
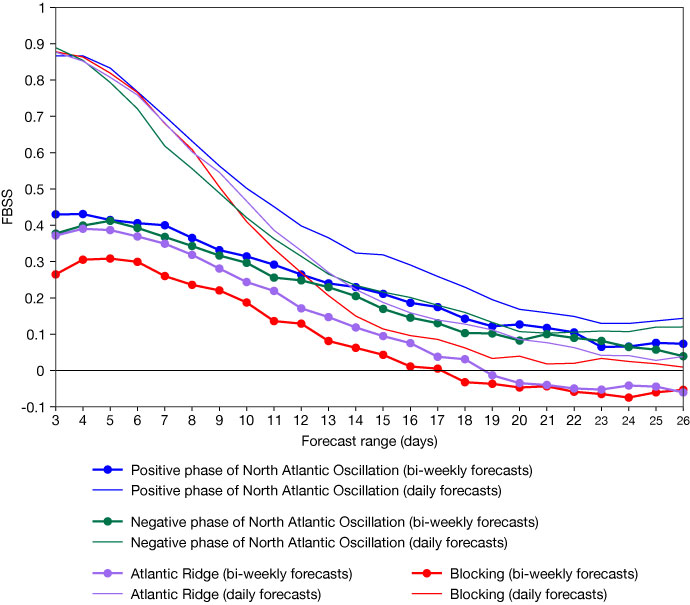
Figure 2 compares the Fair Brier Skill Scores (FBSS, after Ferro, 2014) of an experimental set of daily ensemble forecasts with the FBSS of a subset of the same experimental set considering just two forecasts per week. The subset represents the current frequency configuration with forecasts issued every Monday and Thursday. The experimental set covers 20 winters (December to February), and the ensemble has 11 members. The FBSS is based on the classic Brier score with an additional correction term that compensates for skill underestimation due to a relatively small ensemble size. Figure 2 shows that the skill of forecasts issued daily is considerably larger than the skill of forecasts issued twice weekly. The benefit of daily forecasts remains evident well beyond the medium range. For example, at forecast day 15, predictive skill for the positive North Atlantic Oscillation regime increases from 0.22 to 0.35. Even for the most challenging of the regimes, the blocking regime, the skill is enhanced.
Increasing ensemble size
The 51‑member ensemble in the current configuration cannot always properly capture small shifts in forecast probabilities when the signal is very small compared to the ensemble spread, which is often the case in high latitudes. Doubling the ensemble size to 101 ensemble members will provide a more accurate representation of the forecast probability distribution function. In particular, this will ensure a more accurate prediction of the tail of the probabilistic distribution function, which is important for a more accurate prediction of the probability of extreme events. The increase in ensemble size will also help improve probabilistic skill scores, which are dependent on ensemble size (e.g. Weigel et al., 2008). Indeed, Figure 3 shows that the Continuous Ranked Probability Skill Score (CRPSS) is significantly improved at all lead times and for all parameters when increasing the ensemble size from 51 to 101 members, and the improvement is statistically significant. The ensemble size can be increased further by using a lagged ensemble approach as mentioned in the previous section. For example, a 2‑day lagged ensemble would include 300 members.
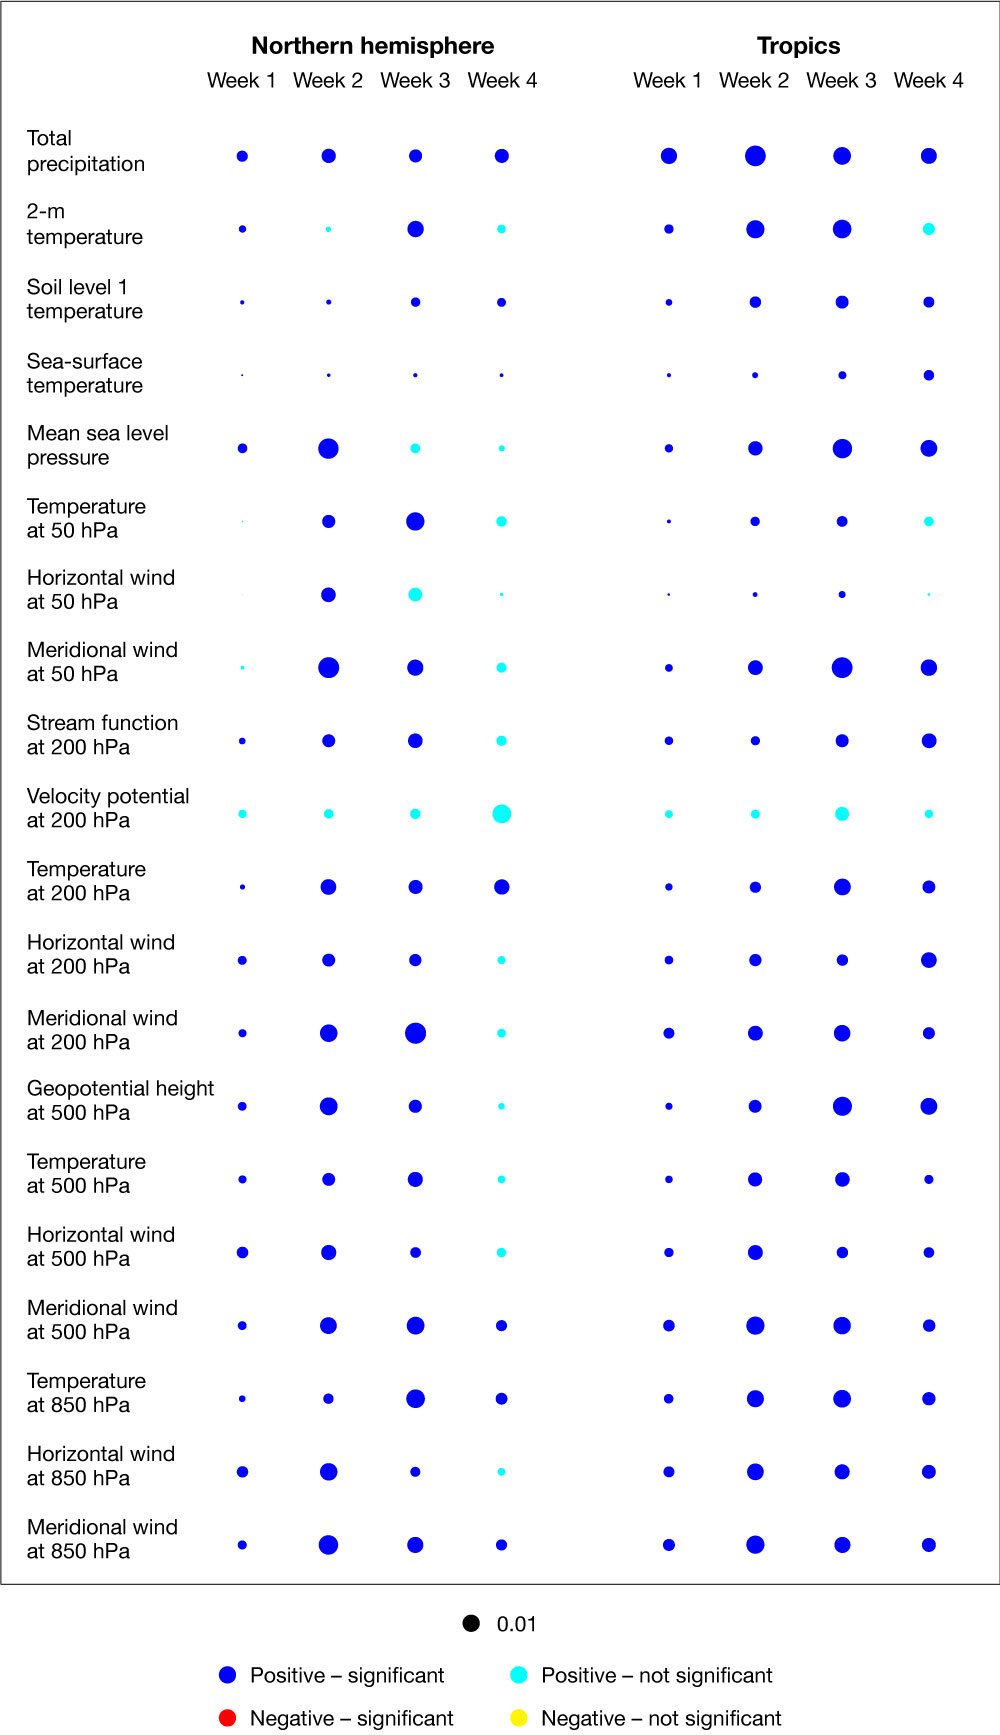
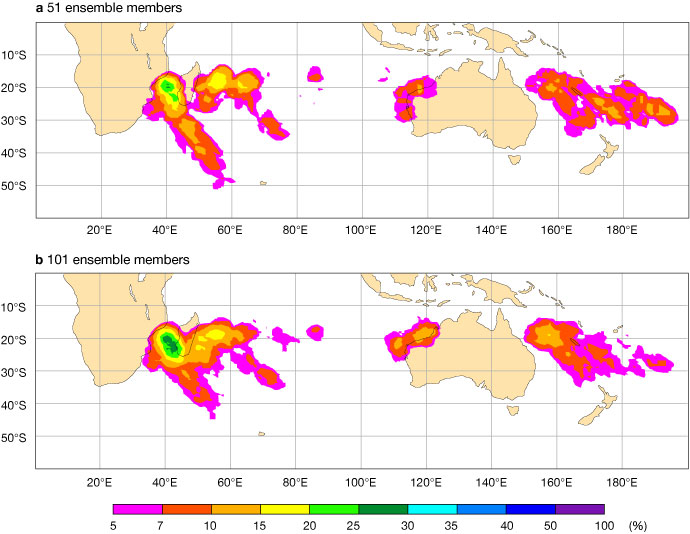
Figure 4 shows an example of the impact of increasing the ensemble size to 101 ensemble members for one of the extended-range forecast products: the probability of tropical cyclone tracks within 300 km over a weekly period, in this case week 4. Figure 4 shows that the areas of high probability of tropical cyclone tracks look broadly similar between the 51- and 101‑member ensembles, but there are significant differences: for instance, the 101‑member ensemble forecast displays higher probabilities of a tropical cyclone strike over the Mozambique Channel and west and northeast of Australia than the 51-member ensemble. It also shows lower probabilities east of 180°E. In the event, tropical cyclones did strike in the first three locations and did not strike in the fourth.
The larger ensemble size will also provide a better framework for understanding the prediction of a specific extreme event, by increasing the number of possible outcomes linked to specific large-scale patterns.
The benefits associated with daily forecast frequency and with the larger ensemble size of 101 members will be visible in all products. At the time of writing, the list of products available with the cycle upgrade has not yet been finalised. Based on the testing done so far, it is likely that the weekly mean anomalies (Monday to Sunday) and probabilities for the current range of variables will be produced daily. The model climate distribution will be sampled by using three consecutive re‑forecast sets, as is done currently. MJO products as well as regime probabilities and tropical cyclone products will also likely be available daily.
Decoupling extended- and medium-range ensembles
The new configuration will provide two ensembles every day at 00 UTC: a 51‑member high-resolution ensemble up to day 15, and a 101‑member low-resolution ensemble up to day 46. This will make it possible to create dual-resolution medium-range large ensemble forecasts every day at 00 UTC. For some events which are not too sensitive to the model horizontal resolution, like tropical cyclone tracks, this could lead to more accurate probabilistic forecasts. Running from day 0 with the same resolution during the 46‑day integration will remove all the postprocessing issues associated with the change of resolution at day 15 in the current system.
The choice of keeping the horizontal resolution at 36 km for all extended-range predictions was motivated by results from research experiments where the horizontal resolution of extended-range forecasts was increased up to 9 km. These experiments did not show any statistically significant impacts on extended-range forecast skill scores, as shown in Vitart et al. (2019), despite a more realistic representation of the climate and its extremes. This is consistent with previous studies (e.g. Vitart, 2014). They showed that the improvement in ECMWF operational extended-range forecast skill scores since 2004 could not be associated with the changes in horizontal atmospheric resolution of the operational system. This was, for example, true of the improvement in predictions of the MJO, one of the key sources of extended-range predictability. We note that the impact of the higher resolution during the first 15 days on week 3 or 4 forecast skill scores is not significant, as shown in Figure 34 in Vitart et al., 2019.
There will thus be two sets of re-forecasts in Cycle 48r1: one at a high resolution (Tco1279) up to day 15 to calibrate the high-resolution medium-range ensemble, and one at a low resolution (Tco319) for extended-range forecasts. The main motivation for running extended-range forecasts separately from 15‑day medium-range forecasts is to provide more flexibility for the real-time extended-range configuration. For instance, it allows the extended-range forecasting system to have a larger ensemble size than the medium-range ensemble forecasting system. It also allows more flexibility in the design of the re‑forecasts. Currently, the cost of the re-forecasts is largely dominated by the first 15 days of integrations at 18 km resolution, while the need for large ensemble re-forecasts is not as strong for the medium range as it is for the extended range. This is due to the fact that, for medium-range forecasts, re-forecasts are used only for calibration. For extended-range forecasts, on the other hand, they are used for calibration and skill assessment, and the optimal re‑forecast configuration for calibration is not the same as for skill assessment.
Although decoupled, the medium- and extended-range ensemble systems will remain seamless since, apart from the atmospheric resolution, the models used for extended-range and medium-range forecasting will be identical. This was not the case before 2008. The new dual ensemble balances the resolution enhancements in the medium range with the enhanced probabilistic aspects and frequency in the extended range.
Implementation
The new configuration will be implemented operationally with IFS Cycle 48r1 in 2023. Extended-range forecasts, which are currently archived with the same streams as the medium-range ensemble, will then be coded in GRIB and archived with different streams. These new streams are:
- Extended Ensemble Forecast Hindcast (EEFH)
- Extended Ensemble Forecast Hindcast Statistics (EEHS)
- Extended Ensemble Forecast (EEFO)
- Wave Extended Ensemble Forecast (WEEF)
- Wave Extended Ensemble Forecast Hindcast (WEEH)
- Wave Extended Ensemble Forecast Hindcast Statistics (WEES)
As mentioned above, re-forecasts will also be run separately for the medium range and extended range, since re-forecasts need to be run at the same resolution as the real-time forecasts with which they are associated. Currently, re-forecasts are run twice a week with 11 ensemble members. This will stay the same with Cycle 48r1 for both medium-range and extended-range re-forecast sets. However, it is planned to change this configuration in Cycle 49r1 since the real-time extended-range forecasts are no longer run on a twice-weekly basis. This new configuration has not been finalised at the time of writing but is likely to involve differences between the characteristics of medium-range and extended-range re-forecasts.
Further reading
Ferranti, L., S. Corti & M. Janousek, 2015: Flow-dependent verification of the ECMWF ensemble over the Euro-Atlantic sector. Q.J.R. Meteorol. Soc., 141, 916–924. https://doi.org/10.1002/qj.2411.
Ferranti, L., L. Magnusson, F. Vitart & D.S. Richardson, 2018: How far in advance can we predict changes in largescale flow leading to severe cold conditions over Europe? Q.J.R. Meteorol. Soc., 144, 1788–1802. https://doi.org/10.1002/qj.3341.
Ferro, C.A.T., 2014: Fair scores for ensemble forecasts. Q.J.R. Meteorol. Soc., 140, 1917–1923. https://doi.org/10.1002/qj.2270.
Grams, C.M., L. Ferranti & L. Magnusson, 2020: How to make use of weather regimes in extended-range predictions for Europe. ECMWF Newsletter No. 165, 14–19. https://doi.org/10.21957/mlk72gj183.
Grams, C.M., L. Magnusson & E. Madonna, 2018: An atmospheric dynamics perspective on the amplification and propagation of forecast error in numerical weather prediction models: A case study. Q.J.R. Meteorol. Soc., 144, 2577–2591. https://doi.org/10.1002/qj.3353.
Vitart, F., 2014: Evolution of ECMWF sub-seasonal forecast skill scores. Q.J.R. Meteorol. Soc., 140, 1889–1899. https://doi.org/10.1002/qj.2256.
Vitart, F., M.A. Balmaseda, L. Ferranti, A. Benedetti, B. Balan-Sarojini, S. Tietsche et al., 2019: Extended-range prediction. ECMWF Technical Memorandum No. 854. https://www.ecmwf.int/en/elibrary/19286-extended-range-prediction.
Vitart, F. & Y. Takaya, 2021: Lagged ensembles in subseasonal predictions. Q.J.R. Meteorol. Soc., 147(739), 3227–3242. https://doi.org/10.1002/qj.4125.
Weigel, A., D. Baggenstos, M.A. Liniger, F. Vitart & C. Appenzeller, 2008: Probabilistic verification of monthly temperature forecasts. Mon. Wea. Rev., 136, 5162–5182. https://doi.org/10.1175/2008MWR2551.1.