
From the early days of the COVID-19 pandemic, air pollution has emerged as an area of strong scientific and general public interest. Air pollution has indeed been one of the most visible markers of the effect of lockdown measures. This has taken the form of a substantial observed decrease in the concentrations of certain pollutants like nitrogen dioxide (NO2) or fine Particulate Matter PM2.5 and PM10 (particles finer than 2.5 micrometres and 10 micrometres respectively). In particular, the measurements of the Copernicus Sentinel-5P TROPOMI satellite instrument, as reported by the Copernicus Atmosphere Monitoring Service (CAMS), the Royal Netherlands Meteorological Institute (KNMI) and the European Space Agency (ESA), have had a prominent place in the media. They showed fairly abrupt changes in different parts of the world as restriction measures were enforced or lifted. CAMS data have also been used in epidemiological studies and have been supporting the World Meteorological Organization’s Global Atmospheric Watch programme in organising international efforts.
Initial response
Initially, interpretation of lockdown effects on anthropogenic emissions has been done in a fairly crude way, by simply comparing the satellite-derived pollutant amounts in 2020 with the ones observed for the same period of the year in 2019 and other recent years. Such studies have also been carried out similarly with surface observations. As can be seen in Figure 1, which presents CAMS daily surface analyses of NO2 together with information on the dates when lockdown or restriction measures were in place for the city of Barcelona, the naïve interpretation of concentration changes by a reduction in emissions can be deceptive. Indeed, one can see in this example that, more than a month before any restriction measure was taken, 2020 levels of NO2 were noticeably lower than in the three previous years. This can be easily understood because the month of February 2020, as shown by the Copernicus Climate Change Service (C3S), was exceptionally warm. The result was in particular higher than normal planetary boundary layer heights across most of Europe, driving the surface concentrations of pollutants down without any change in emissions compared to the ‘business as usual’ (BAU) situation.

At the end of March 2020, CAMS opened a web page (https://bit.ly/3jVym4W) to gather relevant information from its portfolio of products and make results more readily accessible. The idea was to respond to the high demand from epidemiologists, media and the general public (Vincent-Henri Peuch et al., 2020). This has inter alia shown a very good consistency between ground-based and satellite estimates of NO2, confirming that measuring air quality from space has become a reality with Sentinel-5P/TROPOMI. It also facilitated a very strong uptake of CAMS information in top tier media outlets throughout the spring season, confirming ECMWF Copernicus as a go-to source for fast and accurate information and expertise about air pollution. Importantly, CAMS helped convey caveats about the interpretation of data, pointing to the importance of considering weather aspects but also to the importance of sampling and cloud contamination in the case of satellite data (https://bit.ly/3jVdvif). The next two sections will show how CAMS products helped to shed light on the COVID-19 and air pollution links.
Focus on China and Europe
The work of the CAMS team for estimating air pollution changes due to COVID-19 measures first focused on China (https://bit.ly/3nLrp92). Because of the lack of real-time access to surface observations, the work used satellite Aerosol Optical Depth (AOD) data from the two NASA MODIS instruments and concentrated on PM2.5. The CAMS global system, the COMPO configuration of the Integrated Forecasting System (IFS), includes estimates of emissions. It ignores the changes due to the lockdown measures in place in February 2020 and is thus representative of what would have happened under BAU conditions. As depicted in Figure 2, we have compared the February 2020 anomaly in surface PM2.5 compared to the average of February 2017–19 in the analyses assimilating AOD observations (left) and in the control run without data assimilation (right). Because of the assimilated observations, the former is capable of capturing the actual situation of February 2020 in China (including effects of lockdown) while the latter is an estimate of what would have happened if there had been no pandemic and no restriction measures. What the figure shows is that, while from an interannual point of view no marked anomaly for 2020 compared to the three previous years would have been expected under BAU conditions (right panel), PM2.5 concentrations were lower by 20 to 30% over large parts of China (left panel), giving a first quantitative measure of the effect of lockdown over this region.

CAMS continued to work on this topic, focusing on Europe and refining the methodologies used to address the question of the air quality changes. Barré et al. (2020) report a very innovative method, which combines Sentinel-5P/TROPOMI data and machine learning (ML). In order to estimate the changes, an ML algorithm was trained on 2019 and used to estimate 2020 BAU values, for the purpose of comparing with the actual measurements of the satellite in 2020. This allowed changes in NO2 to be estimated across all the cities in Europe with above 500k inhabitants, giving estimates ranging from about 50 to 60% for Madrid, Turin and Milan, down to less than 20% for Stockholm or Belgrade.
CAMS also worked in parallel on another approach using the ensemble of 11 regional air quality models used for daily forecasting: CHIMERE (Ineris, France), DEHM (Aarhus University, Denmark), EMEP (Met Norway), EURAD-IM (Cologne University, Germany), GEM-AQ (WUT/IEP, Poland), LOTOS-EUROS (TNO/ KNMI, the Netherlands), MATCH (SHMI, Sweden), MINNI (ENEA, Italy), MOCAGE (Météo-France), MONARCH (BSC, Spain) and SILAM (FMI, Finland). These models have been run over the period mid-March to end of April under the coordination of Ineris (France) using two sets of emissions: one corresponding to BAU conditions and the other to a COVID-19 emissions dataset for the first period of generalised lockdown between mid-March and the end of April.
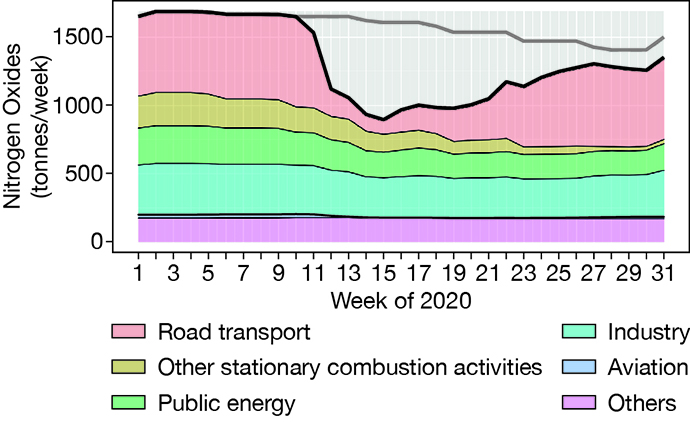
The COVID-19 emissions dataset has been prepared by the Barcelona Supercomputing Centre by working with publicly available data, such as mobility/traffic information available from Google and Apple, energy statistics from the European Network of Transmission System Operators for Electricity or flight activity reports (Guevara et al., 2020). Daily emission change factors have been developed for five of the most affected activity sectors including: road transport, energy and manufacturing industry, aviation, residential & commercial and shipping. Figure 3 shows the weekly evolution of emissions of Nitrogen Oxides in Spain over the first half of 2020. It shows a sharp decrease of up to about 50%, especially marked in week 11 (March 9 to 15), followed by a slow recovery starting in week 21 (May 18 to 24). It is estimated that at the end of July, activity levels were still not up to normal (about 10% down). The sectors with stronger reductions were road transport and aviation, although the latter only represents a very small fraction of total Spanish emissions.
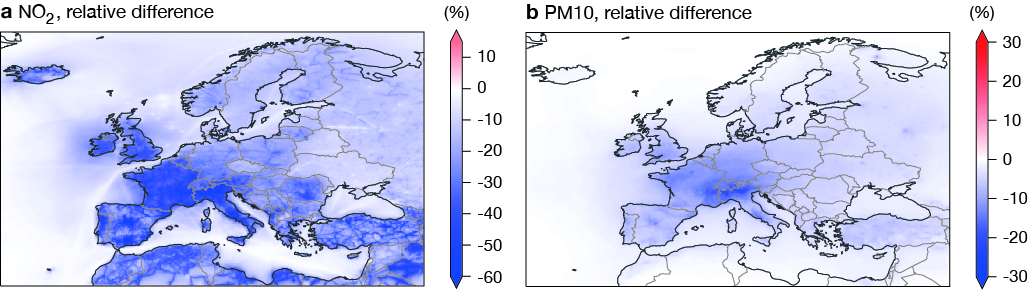
With these COVID-19 emissions on the one hand and the BAU ones on the other hand, the 11-member ensemble has been run and provided estimates of the changes in key pollutant concentrations. These results factor in the effect both of emissions reduction and of the specific meteorological conditions. Figure 4 depicts the relative difference between the two ensembles of runs for NO2 and PM10. The map shows differences of up to about 60% for NO2 and 20% only for PM10. This is because one of the most affected sectors, road transport, represents a much larger fraction of the total Nitrogen Oxides emissions than of the total Particulate Matter emissions. The maps also show marked differences across Europe regarding the reductions that are found. Nicely, the quantitative findings are fully consistent with the other approach based on Sentinel-5P and ML, although the two results are based upon entirely different methodologies. These studies have been shared with the European Environment Agency (EEA) to complement their work based on surface observations in the ‘Air quality in Europe’ report that the Agency publishes annually. It has to be noted that these reductions concern so-called background concentrations, which is what the CAMS regional air quality models can capture, operating at 10 km x 10 km horizontal resolution. At the local scale, for instance next to a busy road, reductions are expected to have been much larger.
Epidemiology
Estimating such changes is an important input for epidemiologists. For instance, scientists at the London School of Hygiene and Tropical Medicine, working in collaboration with the Multi-Country Multi-City collaborative research network, are using the inputs from the CAMS BAU vs COVID-19 model simulations. They do this by carrying out epidemiological analyses under different exposure scenarios, in order to quantify the health impacts of the air pollution changes during the period. This will be an important contribution for the a posteriori analysis of the COVID-19 pandemic, as reductions in NO2 and PM10 over parts of Europe are expected to have decreased the number of deaths due to air pollution.
Of course, another more fundamental reason for looking into air quality and COVID-19 connections is that it is speculated that exposure to air pollution could be a factor in reducing the immune response and be conducive to higher infection rates. While this is fairly well-established in animals and for other diseases like seasonal influenza, it had to be assessed in the case of COVID-19. In fact, there are two slightly different questions: one is about short-term (episodic) exposure to air pollution events and the second is about long-term exposure to chronically high levels of air pollution. For such studies, CAMS data are very well suited, as analyses and reanalyses allow information to be obtained about exposure if one knows where people have been living in the years before and during 2020. CAMS has partnered with a large cohort study led by the Hopitaux de Strasbourg (France), which has obtained detailed data about over a thousand elderly people in France and Belgium. The analysis of their exposure since January 2018 and during the first months of 2020 is in progress using CAMS data about main air pollutants, UV radiation and weather parameters, in partnership with the University of Harvard (USA). Such detailed studies take time and the international literature already provides results from correlative studies, which are faster to conduct but may lead to spurious effects as correlation is not causation. Some figures have appeared, such as exposure to +1mg/m3 PM2.5 for 10 years could equate to +8% in COVID-19 deaths in a study over the USA (Wu et al., 2020). Some of these studies used CAMS data for their work, such as Borro et al. (2020). They mention using CAMS because of the complete spatio-temporal coverage offered and because of its quality: “The CAMS near-real-time reanalysis is the most recent global reanalysis data set of atmospheric composition and air quality, with a demonstrated unprecedented level of accuracy and space–time resolution.” The study looked into the case of 110 Italian provinces over the period 20 February to 31 March 2020 (short-term exposure). It investigated positive correlations between PM2.5 levels and the incidence (r = 0.67), the mortality rate (r = 0.65) and the case fatality rate (r = 0.7) of COVID-19. Another area of investigation, more putative, is the potential role of aerosols (fine particulate matter in suspension in air) as vectors for the SARS-CoV-2 virus. In principle, airborne transmission of the virus can occur through inhalation of PM2.5 particles, which could stay airborne for a few hours. While the phenomenon is most probably effective indoors (with some decisive measurements made in some hospitals), current thinking is that it is a minimal route of contamination outdoors. More work is in progress about this.
Conclusion
CAMS has made some decisive contributions to the study of possible links between COVID-19 and air quality, especially in China and Europe. It has done this by comparing expected air quality based on normal levels of activity with analysed air quality based on actual levels of activity. CAMS has also contributed to studies of the health impacts of the air pollution changes during the period and the possibility that exposure to air pollution could be a factor in reducing the immune response. Finally, CAMS has been very actively supporting the World Meteorological Organization’s Global Atmospheric Watch programme in organising international efforts looking at these different questions. Over one hundred groups from all over the world have been working on similar questions and, as results are becoming available, it will be possible to confront and consolidate the findings.
Further reading
Borro, M., P. Di Girolamo, G. Gentile, O. De Luca, R. Preissner, A. Marcolongo et al., 2020: Evidence-Based Considerations Exploring Relations between SARS-CoV-2 Pandemic and Air Pollution: Involvement of PM2.5-Mediated Up-Regulation of the Viral Receptor ACE-2, Int. J. Environ. Res. Public Health, 17, 5573.
Barré, J., H. Petetin, A. Colette, M. Guevara, V.-H. Peuch, L. Rouil et al., 2020: Estimating lockdown induced European NO2 changes, Atmos. Chem. Phys. Discuss., under review, doi:10.5194/acp-2020-995.
Guevara, M., O. Jorba, A. Soret, H. Petetin, D. Bowdalo, K. Serradell et al., 2020: Time-resolved emission reductions for atmospheric chemistry modelling in Europe during the COVID-19 lockdowns, Atmos. Chem. Phys. Discuss., under review, doi:10.5194/acp-2020-686.
Peuch, V.-H., C. Buontempo & R. Engelen, 2020: Copernicus contributes to coronavirus research, ECMWF Newsletter No. 164, 8–9.
Wu, X., D. Braun, J. Schwartz, M.A. Kioumourtzoglou & F. Dominici, 2020: Air pollution and COVID-19 mortality in the United States: Strengths and limitations of an ecological regression analysis, Science advances, 6, p.eabd4049.