The Euronews channel has begun to give climate and air quality updates using data from the Copernicus Climate Change Service (C3S) and the Copernicus Atmosphere Monitoring Service (CAMS). Weather presenters for a number of national TV channels have also begun to incorporate C3S information into their reports. The development is part of a drive by the two EU-funded Copernicus services operated by ECMWF to broaden the audience for the climate and atmospheric composition information they provide.
Since December 2017, Euronews has been airing exclusive daily 24-hour air quality forecasts for Europe in 41 countries and monthly updates dedicated to the planet's changing climate in 156 countries. Based on CAMS data, an index ranging from 1 (very good) to 5 (very poor) is used to provide air quality forecasts for major European cities. The monthly climate update presents the latest C3S climate data for Europe and the world and explains how recent events relate to climate change.
Climate attribution
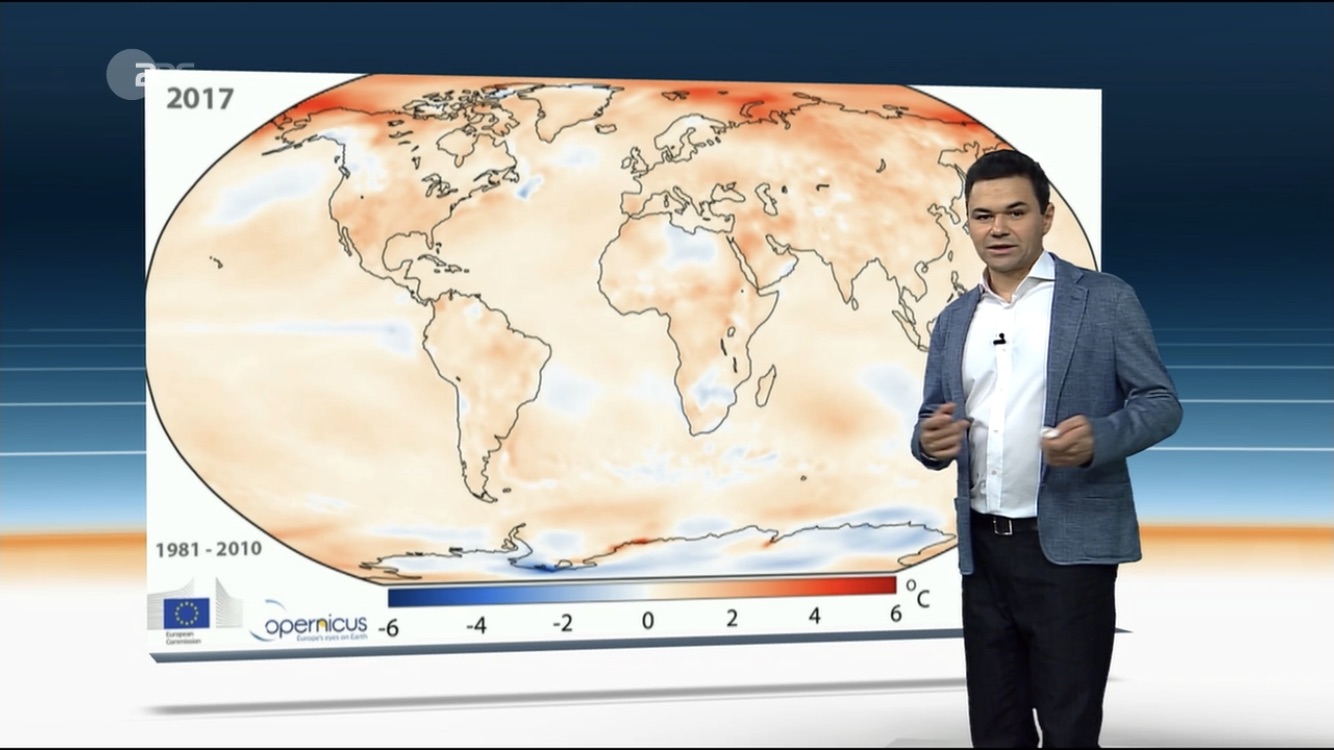
TV weather presenters in countries such as Belgium, Germany, Greece, the Netherlands and Switzerland have begun to explain Copernicus data to their audiences. Among other things, the data can help them to clarify the links between weather events and climate change. Özden Terli, a weather presenter at the German publicly-funded TV channel ZDF, says there is growing interest in understanding such links. “It’s very important to speak regularly about climate change and how the already changed climate influences weather patterns,” he recently told the Up Front magazine published by the International Association of Broadcast Meteorology (www.iabm.org/latest-up-front). He says that it is useful for people to know that certain weather events, such as the heatwave in southern Europe in the summer of 2017, are much more likely today than they were in pre-industrial times.
Dick Dee, the Deputy Head of C3S, emphasises that any climate attribution must be scientifically sound. It can only be about probabilities as no individual weather event can be said to be caused by climate change. “The idea of attribution is to see whether the statistics of extreme weather events are affected by climate change,” he says. Dick and his C3S colleagues are in the initial stages of setting up a pilot scheme that will be able to perform the necessary calculations within a week of specific weather events. To begin with, the scheme will look at cold snaps and heat waves since these are the kind of events for which the best statistics are currently available. The pilot scheme is due to be launched in 2019. In the meantime, weather presenters who wish to use C3S monthly climate charts and data in their broadcasts can obtain these from the C3S website: https://climate.copernicus.eu/monthly-maps-and-charts.