Polly Schmederer, Graduate Trainee in ECMWF’s Forecast Department
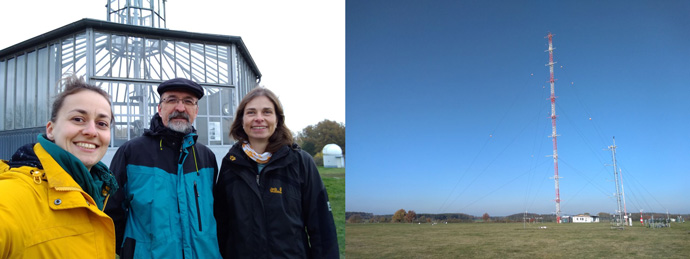
Recently I was lucky enough to be invited by Frank Beyrich and Claudia Becker from the German National Meteorological Service (DWD) to visit a so-called observational super-site at Falkenberg, Germany (associated with Meteorologisches Observatorium Lindenberg - Richard-Aßmann-Observatorium (MOL-RAO)) (Figure 1).
Super-sites provide a comprehensive range of observations, such as temperature, pressure, wind, and humidity, not only at the surface but also in the lower boundary layer and the soil. At selected locations they enable in-depth analysis of the processes in the near-surface atmosphere, the soil, and their interface.
ECMWF verifies its near-surface forecasts (of 2 m temperature for example) against observations from synoptic weather (SYNOP) stations. Globally, around 10,000 SYNOP stations report near-surface parameters such as pressure, 2 m temperature and 10 m wind speed. Those routine evaluations reveal systematic biases in the surface parameters which need further information about atmosphere and soil.
Measurements gathered at super-sites provide this valuable information for assessing the quality of near-surface weather forecasts and for identifying sources of systematic errors.

Figure 1. Left: Polly Schmederer, Frank Beyrich, and Claudia Becker (from left to right) in front of the historical winch house; right: the observational super-site at Falkenberg, Germany, showing tower and mast.
Systematic errors of near-surface weather parameters
ECMWF’s medium-range forecasts of near-surface weather parameters, such as 2 m temperature, humidity and 10 m wind speed, have become more skilful over the years, following the trend of improvements in the forecast skill of upper-air fields. However, they are still affected by systematic errors which have proved difficult to eliminate.
In summer, there is for example a general underestimation of the amplitude of the diurnal cycle of 2 m temperature. Although there have been minor changes in these biases due to model upgrades in recent years, they are generally persistent in terms of geographical patterns and annual and diurnal variations (Haiden et al., 2018). ECMWF evaluates the quality of forecasts of 2 m temperature, 2 m dew point and 10 m wind speeds against observations from SYNOP stations on a routine basis. However, this does not provide information about vertical profiles of errors in the lower atmosphere, in the soil, or at the surface itself.
Super-site observations – helping us understand processes
In a recent internal ECMWF project focused on ‘understanding uncertainties in surface–atmosphere exchange’ (USURF), ECMWF started to use data from super-sites such as Falkenberg and Cabauw (the Netherlands) more systematically to evaluate the quality of forecasts in the lowest part of the atmosphere (up to 100m) and in the soil, in an attempt to disentangle sources of forecast error in near-surface weather parameters.
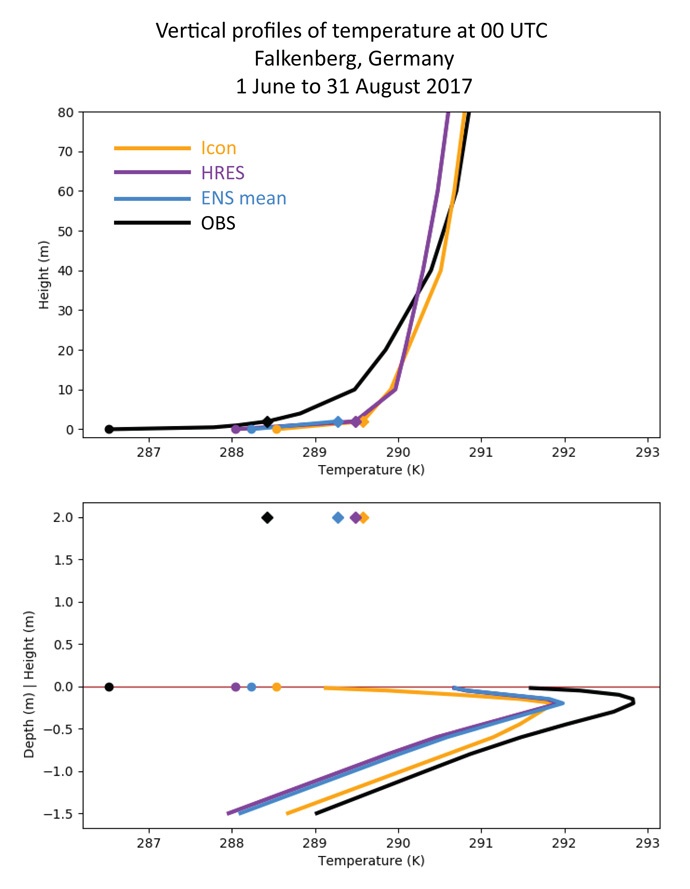
Figure 2 shows some example temperature profiles, comparing ECMWF forecasts and DWD’s ICON model forecasts with observations at Falkenberg. In summer 2017 at 00 UTC, the ECMWF high-resolution forecast (HRES) is too warm, not only at 2 m height, but also at the surface and up to 20 m. Above 35 m, the HRES is too cold and the night-time inversion is not sufficiently pronounced. In the soil, the HRES is too cold at all depths. Systematic errors of ensemble forecasts (ensemble mean) behave similarly to the HRES, being too warm at 2 m and at the surface, and too cold in the soil.
DWD’s ICON is also too warm at, and close to, the surface, but above 60 m it matches the observations well for the selected period. In the soil, ICON is too cold in the first soil layer and matches observations well in deeper soil layers.

Figure 2. Observed and predicted profiles of air temperature (top) and soil temperature (bottom) at Falkenberg. Circles show skin temperature and diamonds show 2 m temperature. The forecasts are for day 4 at 00 UTC and are averaged over summer 2017 (June, July and August). For the study period, only near-surface air temperatures were available for the ensemble forecasts, since model level data are not operationally archived.
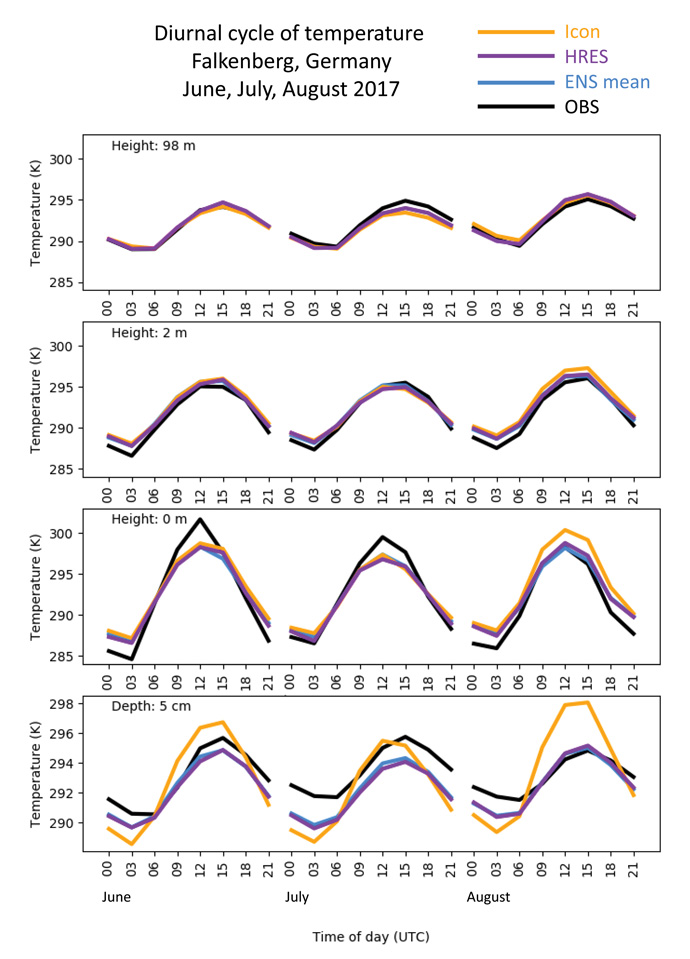
To get a better idea of the temporal evolution of the forecast biases at Falkenberg, monthly averaged diurnal cycles of temperature at different heights in the atmosphere and different depths in the soil were examined (Figure 3).

Figure 3. Monthly averaged diurnal cycles of temperatures at 98 m and 2 m height, the surface and 5 cm depth at Falkenberg at forecast day 4 for the months of June, July and August 2017.
The forecasts match well higher up in the atmosphere (e.g. 98 m), however the closer the selected height is to the surface, the bigger the underestimation of the diurnal cycle. The ECMWF HRES and ensemble mean slightly overestimate the diurnal cycle in the first soil layer, being too cold at night. ICON is warmer than the IFS in all soil layers during the day and slightly colder during the night which leads to a slightly stronger overestimation of the diurnal cycle for the first soil layer.
Land–atmospheric coupling as one potential error source
The main conclusion from the diurnal cycle evaluation for the summer period is that there is probably too much energy exchanged between the atmosphere and the soil. This means, for example, that during the night too much energy is extracted from the soil and transferred to the atmosphere. This results in soil temperatures being too cold and skin and 2 m temperatures being too warm.
A sensitivity experiment was performed to understand whether reducing the strength of this thermal land–atmosphere coupling, and thereby of the energy transfer between the soil and atmosphere, would lead to better near-surface temperature forecasts. As expected, this change reduced the night-time 2 m and skin temperatures at Falkenberg. It also cooled the temperature in the first soil layer in day-time. The 2 m temperature biases in Falkenberg were almost halved and almost entirely removed at Cabauw.
However, on the European scale, the impact of this reduction in thermal coupling varies and leads to smaller biases at some stations, but larger at others. On average, reducing the thermal land–atmospheric coupling does not have a positive effect on 2 m temperature forecast performance on the European scale.
This suggests that these biases are partly due to other factors. One of these could be the representation of vegetation in semi-arid areas, where low vegetation partially dies in summer, a process which is not represented in the model. Another potential issue is surface heterogeneity. The model assumes homogeneity in regions where in reality vegetation and soil types vary on small scales, or where the dominant soil and vegetation types are not representative for the measurement location.
The Falkenberg observatory
It was very interesting to see the actual super-site (Figure 1), discuss the verification results and learn about the challenges when measuring near-surface parameters in-situ. It confirmed the need for estimating the observation error, which depends both on measurement uncertainties and on the representativeness of the observations. The upcoming measurement campaign FESSTVaL with a focus on sub-mesoscale spatio-temporal variability around the super-site with more than 100 weather stations within a small radius around the observatory will enable a better assessment of the representativeness of the super-site.
A quantitative assessment of the representativeness of observations at the locations of SYNOP stations and super-sites will help ECMWF to make progress towards reducing near-surface forecast errors. Also, updated datasets of vegetation, land use, and soil properties could help address some of the errors in near-surface temperature.
