
Image: Serjio74/iStock/Getty Images Plus
ECMWF has started to use Mode-S aircraft observations again to improve the quality of forecasts after this type of data was found to be used in too large numbers during the recovery from the COVID-19 pandemic.
Aircraft observations of wind and temperature are used together with many other types of observations to help estimate the state of the Earth system at the start of forecasts, known as the analysis. At ECMWF, aircraft reports are second only to satellite data in their impact on forecasts.
The aircraft reports come from different sources: in addition to data from the WMO’s Aircraft Meteorological Data Relay (AMDAR) programme and a small number of other data, in July 2020 ECMWF started to assimilate Mode-S data over Europe.
The use of Mode-S data was suspended in November 2022 when it became evident that the rapid increase in data volumes following the COVID-19 pandemic would require the development of mechanisms to control data density.

The chart shows the use of Mode-S data and other aircraft data in operations for a 30-minute period on 10 January 2024. It illustrates that the number of Mode-S data is still very much higher than that of other aircraft data sources used in Europe.
What are Mode-S data?
Mode-S data are derived from air traffic control data. These data are not originally intended for meteorological use and need to be processed to make them usable.
For example, they include the speed of the aircraft relative to the air. From that, with positions of the aircraft a few minutes apart, the wind can be determined.
That work is performed by the Royal Netherlands Meteorological Institute (KNMI). ECMWF uses the data that have been processed by KNMI.

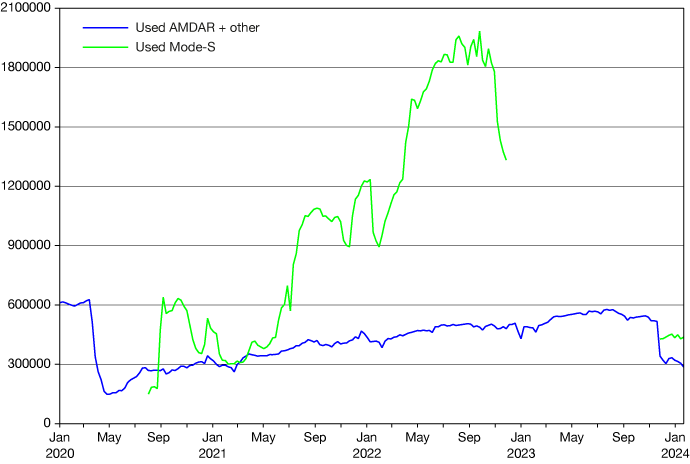
The chart illustrates the number of aircraft reports used in 24 hours (weekly average). It shows how the number of Mode-S reports went up in the wake of the pandemic, far beyond the level of AMDAR reports and others, before their use was interrupted for a year.
Adjusting the numbers
Overall, over Europe about 100 times more data are available from Mode-S than from AMDAR. ECMWF used only about 5% of the Mode-S data in 2020. However, as data volumes increased after COVID-19 measures ended, the data assimilation system to process the observations was overburdened.

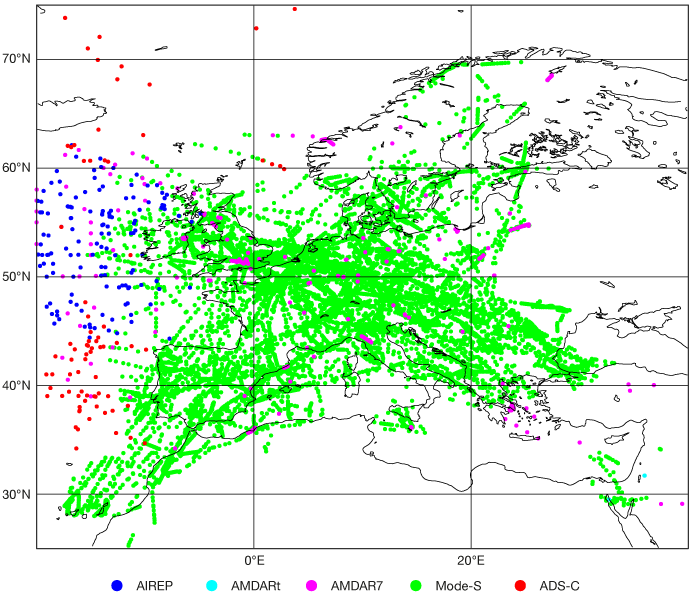
Routine monitoring in the wake of COVID-19 showed that, in parts of Europe, using a large number of Mode-S observations led to particularly large deviations of the wind speed analysis from observations. This is shown here for a height between 0 and 400 hPa and for the period 2 to 31 August 2022. Examples like this led us to question whether including the observations still improved forecasts. Current maps similar to this are available from our observing system monitoring web page.
ECMWF’s 4D-Var data assimilation system starts from a previous short-term forecast and iterates to produce an analysis that is closer to the latest weather observations.
It was found that the procedure did not produce optimal results for the large number of Mode-S observations used after COVID-19, in the limited time available for it.
With a smaller number of Mode-S observations, on the other hand, the impact on forecasts became positive again.

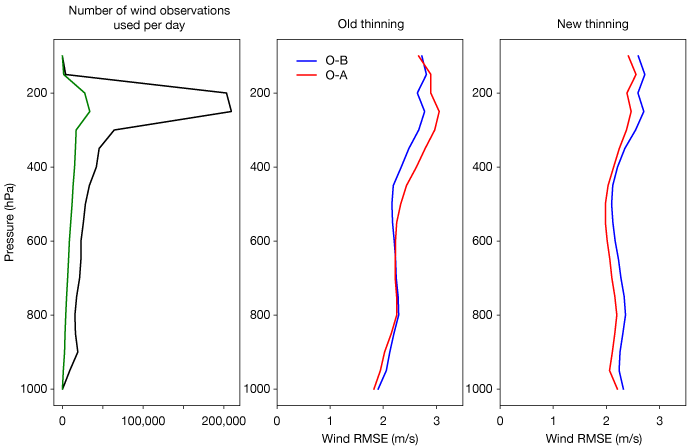
The left-hand chart shows the reduction in Mode-S data using the new thinning (green line) compared to the old thinning (black line). The two right-hand charts illustrate the effect this had on the difference in root-mean-square error (RMSE) between observations and a short-term forecast (background) on the one hand (O–B), and between observations and the analysis on the other (O-A). They show that, with the new thinning of Mode-S data, the analysis has a smaller wind error than the background. The charts concern mid-European Mode-S data from June to August 2022.
The new system was introduced last November after not using any Mode-S data for 12 months. It includes a new method of thinning the data.
“In the previous system, individual aircraft tracks were considered and time-thinning was applied to them,” ECMWF scientist Bruce Ingleby says. “This led to too much data overall. The new system uses ‘box thinning’: the atmosphere is divided into boxes, and just one aircraft report is used for each box.”
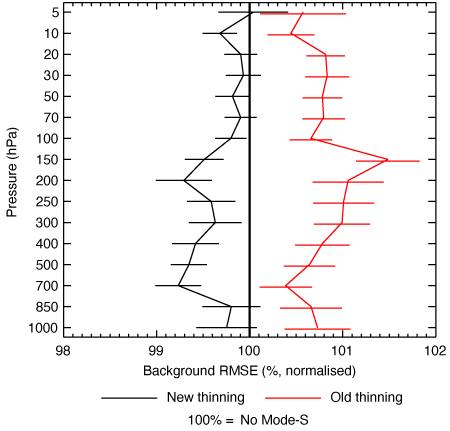
At short range, upper tropospheric winds over Europe are up to 8% better. The impact of using a smaller number of Mode-S observations, with a new thinning method, is particularly clear when compared against using no Mode-S data. This is shown below for temperature observations.

This graph shows the impact of using the previous aircraft thinning in the summer of 2022 in red, and that of the new aircraft thinning in black, against the vertical 100% line, which represents no use of Mode-S data. It shows that the root-mean-square error (RMSE) of short-term forecasts (the ‘background’) is reduced by the new use of Mode-S data across all pressure levels, while it was increased by the previous use of Mode-S data. The graph covers data from 1 June to 31 August 2022 in the northern hemisphere compared with radiosonde temperature data. The horizontal lines are 95% confidence intervals.
“This example shows the importance of constant vigilance when monitoring the global observing system. Not just the quality of observations but also data numbers are having an impact upon the analysis and forecasts,” Bruce says. “In this case, there was nothing wrong with the observations, we were simply using too many of them.”
Thanks to the UK Met Office and KNMI, ECMWF will have access to global Mode-S data in the near future – a particularly exciting prospect is the availability of more wind data in the tropics.
For a more general assessment of the impact of the COVID-19 pandemic on weather forecasts, see the article by Bruce Ingleby et al. in Geophysical Research Letters.
