
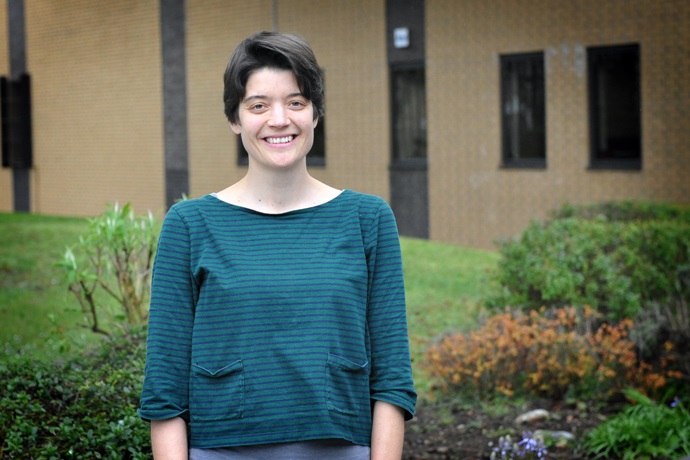
Freja Vamborg joined ECMWF in 2017 to work for the Copernicus Climate Change Service.
The EU-funded Copernicus Climate Change Service (C3S) implemented by ECMWF presented the European State of the Climate 2018 report at a top geoscience meeting in Vienna, Austria, on 9 April 2019. Freja Vamborg is the scientist who pulled the report together.
Fifteen years ago, Freja was a mathematics graduate concerned about climate change and wondering where to turn for her career.
She opted for a master’s in climate change, followed by a PhD on land surface–precipitation interactions in northern Africa during the Holocene. The Holocene stretches back 12,000 years, a time when nobody collected Earth observations for climate studies.
“There are nevertheless some data, such as pollen records, which can tell us something about the climate at the time,” Freja says. “During my PhD, I used climate models to gain a better understanding of the factors that led to a greener Sahara about 6,000 years ago.”
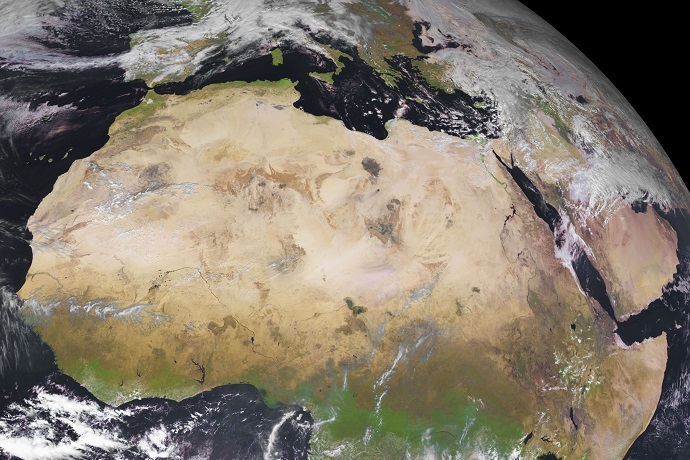
The Sahara Desert seems to be knocking at Europe’s door in this image taken by EUMETSAT’s Meteosat-11 satellite on 10 February 2019. Pollen records indicate that the Sahara was greener 6,000 years ago than it is today. (Image copyright: EUMETSAT 2019)
Freja was catapulted from the distant past into the near future when she worked on decadal climate predictions at the Max Planck Institute for Meteorology in Hamburg. In 2017, she took up a position as a senior C3S scientist at ECMWF with special responsibility for communicating climate information to a wider audience.
“There are lots of interesting and important climate stories to tell, and a lot of channels to use,” she says. “One of those channels is the annual European State of the Climate (ESC) report, which we are presenting at the European Geosciences Union General Assembly in Vienna this year.”
Report highlights
ESC 2018 covers European climate trends and events and how they are linked to changes in glaciers, lakes, vegetation, sea ice, river discharge, wildfire activity and sunshine levels.
The report uses many data sources, including ECMWF’s new global atmospheric ERA5 reanalysis. Reanalysis combines vast quantities of Earth observations with model information to create a complete and consistent global weather and climate dataset.
“One of the most significant events in 2018 was the exceptionally warm and dry spring and summer in central and northern Europe,” Freja says.
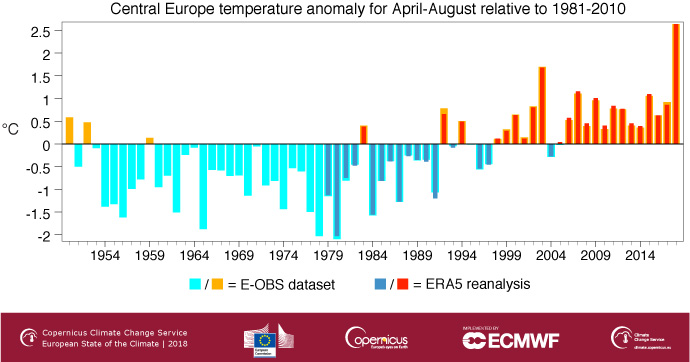
This chart shows that the near-surface air temperature anomaly in central Europe in the period of April to August, calculated relative to the 1981–2010 average for those months, was much larger in 2018 than in any previous year since the middle of the last century. (Credit: ECMWF/C3S/KNMI)
Impacts included agricultural losses, water restrictions, increased wildfire activity and disruption to shipping because of low river levels.
“But across Europe the picture is uneven,” Freja notes, pointing out that conditions in southern Europe were unusually wet. “The result is that precipitation levels in Europe as a whole were close to average in 2018.”
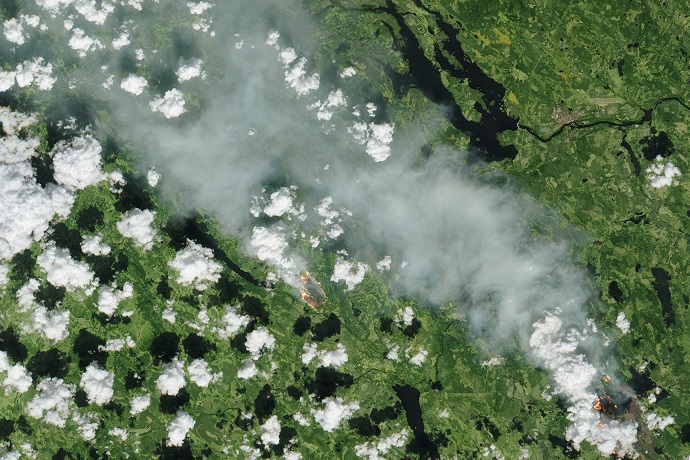
Warm temperatures, little rain and dry vegetation in spring and summer 2018 increased the fire danger in many parts of Europe. This satellite image shows wildfires in Sweden as seen by the Copernicus Sentinel-2 mission on 17 July 2018. (Copyright: contains modified Copernicus Sentinel data 2018, processed by ESA)
In terms of temperatures, the broader picture is of a clear warming trend in Europe as well as globally over the last four decades. In 2018, the average temperature for Europe was one of the three highest on record, and summer temperatures were the highest on record at more than 1.3°C warmer than the 1981–2010 average.
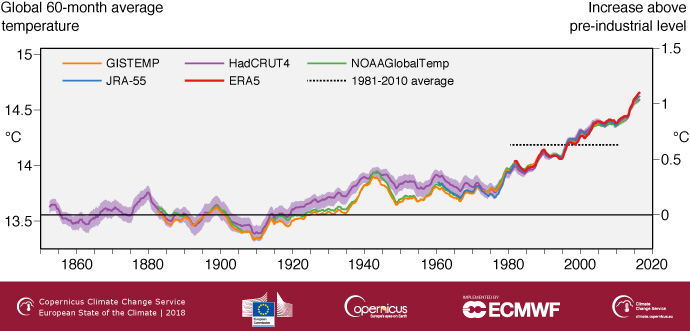
Global surface air temperature (left-hand axis) and estimated change since the preindustrial era (right-hand axis) according to different datasets. (Credit: ECMWF/C3S)
Monthly bulletins
Freja is also closely involved in producing the monthly global and European climate bulletins published on the C3S website.
The bulletins include information on surface air temperatures, sea ice, hydrological variables and other data provided by C3S partners.
The bulletin for February 2019 shows above-average surface air temperatures nearly everywhere in Europe.
“February ended up being much warmer than average due to a winter heat wave late in the month,” Freja explains. “This is in stark contrast to the same period last year, when large parts of Europe experienced unusually cold and snowy conditions. One day I was even able to ski to work, which is rare for this part of the UK!”
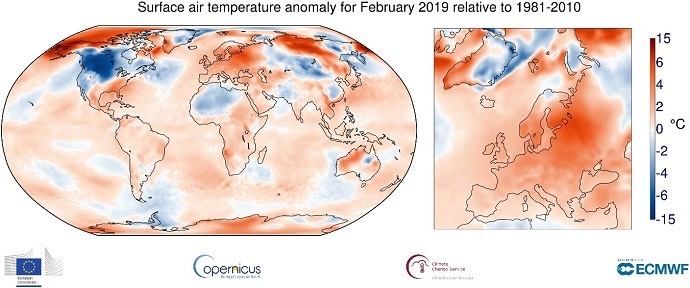
C3S publishes monthly climate bulletins on key climate variables, including average surface temperature globally and in Europe. (Image credit: ECMWF/C3S)
She adds that a possible development for the future is to explore how to communicate uncertainty in the data.
“Using information from the ERA5 lower-resolution ensemble might be one way, but also using different datasets for the same variable, highlighting the respective strengths and weaknesses of different approaches.”
Euronews
Freja’s other responsibilities include working with the C3S communications team on all aspects of climate communication, talking to journalists, and helping to prepare climate stories for the Euronews TV channel.
“I particularly enjoy working on ideas for climate stories for TV,” she says. “There’s a strong appetite among audiences to learn more about climate change, and TV is a good platform to bring this information to a wide audience.”
“An interesting challenge is to find new content that meets the requirement of newsworthiness. After all, climate is something that changes slowly. However, those changes affect many aspects of our lives, so there are many angles to explore.”
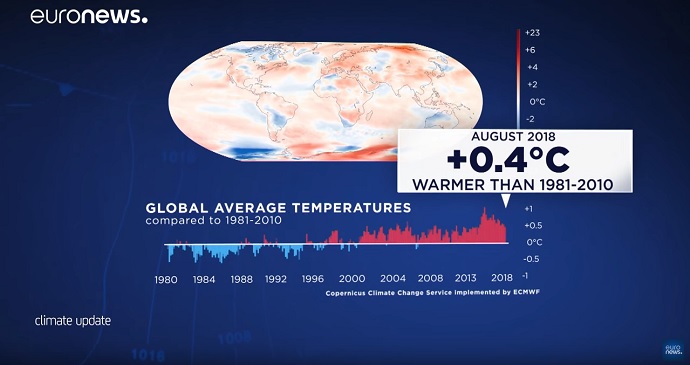
The Euronews channel broadcasts regular climate updates based on C3S data, such as in this video published on 14 September 2018. National TV channels in many European countries have also begun to incorporate climate updates into their news bulletins and weather forecasts.
Freja sees scope to expand and refine the climate communication work done by C3S. “Ideally, I would like to make the data we communicate more traceable and provide easier access to data quality documentation,” she says.
“But this has to be squared with making climate information accessible to a broad audience and not putting people off with technicalities.”
“In the end, what is most important is for climate communication to be based on quality-assured, authoritative and properly documented data and methods.”
