
On 12 October, ECMWF implemented the second upgrade of its Integrated Forecasting System (IFS) in 2021. IFS Cycle 47r3 includes numerous changes to the forecast model, observation usage and data assimilation system, with contributions from many teams across the Centre. There are major developments to the representation of moist physics in the model and increased observation usage in cloudy regions in the assimilation. The upgrade improves the largescale atmospheric circulation and reduces tropical cyclone track errors in both high-resolution (HRES) and ensemble (ENS) forecasts. Several forecast products are modified, such as visibility and wind gusts, and new products are introduced, including clear-air turbulence.
Data assimilation and observation usage
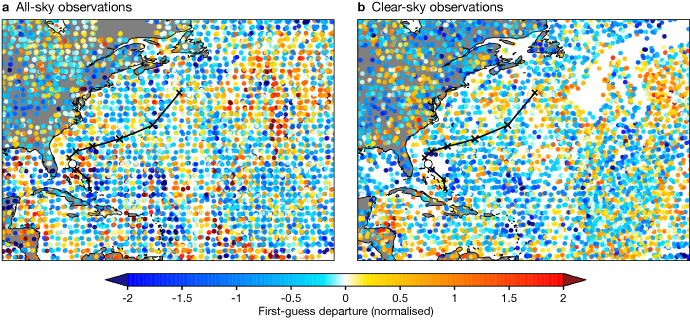
AMSU-A microwave temperature sounding observations in clear-sky conditions have been some of the most powerful observations assimilated into the IFS. Continuing our successful long-term strategy of an all-sky exploitation of satellite radiance observations, AMSU-A data are now assimilated in all-sky conditions (in clear, cloudy, and rainy situations). The increased data usage in cloudy regions leads to an improved fit to independent satellite and conventional observations, and an improvement in forecast scores. The filling of data gaps in cloudy regions is very clear in the case of tropical cyclone Humberto (Figure 1). Not only is coverage improved in the immediate vicinity of Humberto (indicated by the white circle) but also in the surrounding region, which is likely to be important for influencing its subsequent track (indicated by black crosses). Including AMSU-A in the all-sky assimilation is a major step towards an all-sky use of all passive microwave observations. With 47r3, the only passive microwave instrument assimilated in just clear-sky conditions will be ATMS, which is expected to be moved to all-sky assimilation shortly.
Radiative transfer ‘RTTOV’ calculations for hyperspectral infrared sounders now benefit from improved accuracy in the underlying line-by-line spectroscopy calculations, a finer vertical grid and more realistic CO2 concentrations. Assimilation experiments show that the new RTTOV (version 13.0) significantly improves the simulation of these observations and, as a result, the performance of the data assimilation system.
The assimilation of AIRS data now benefits from an updated observation error covariance matrix, including error correlations, bringing the use of AIRS in line with that of other hyperspectral infrared (IR) instruments.
Diagnostics highlighted a probable misassignment of the heights for some low-level Atmospheric Motion Vector (AMV) observations. In a new approach, low-level AMVs placed above model clouds are now reassigned to the level at the average pressure of the model cloud layer (Lean & Bormann, 2021). This has been found to give the best results compared to simply screening out affected AMVs or using the model cloud top or base when considering departure statistics and forecast skill. The change was also supported by independent wind profile observations from the Aeolus satellite. With this change, the AMV assimilation is expected to benefit from improvements in our cloud modelling, as well as from improvements in the height assignment provided by AMV producers.
Weak-constraint 4D-Var (WC-4DVar) has been implemented in the Ensemble of Data Assimilations (EDA) system, where the stratospheric temperature bias is corrected independently for each ensemble member. The reduction in the mean background and analysis errors is comparable to the impact obtained in the HRES analysis when WC-4DVar was introduced in Cycle 47r1, reducing the stratospheric temperature bias by up to 50%.
The European Space Agency’s Doppler Wind Lidar Earth Explorer mission, Aeolus, is an important source of wind observations in clear and cloudy skies from the molecular (Rayleigh) and particle (Mie) channels. The impact of the Mie-cloudy winds is improved in Cycle 47r3 using an updated observation error assignment model, which accounts for representativeness error.
A package of mainly observation-related changes in the assimilation code includes the important introduction of NO2 observations from the TROPOMI instrument on board the Copernicus Sentinel‑5P satellite, using new NOx code for the simplified chemistry in the tangentlinear and adjoint models.
Forecast model
The major revision to the physics in Cycle 47r3 (Figure 2) improves the physical and numerical basis for parametrized processes in the model associated with boundary layer turbulence, convection, subgrid saturation adjustment and cloud and precipitation microphysics. Their complicated interactions are described more simply, efficiently, consistently and scale-independently. The developments are a culmination of work spanning several years and are part of a long-term development of the moist physics in the IFS in preparation for the transition to higher horizontal resolutions (3–5 km) in future operations. The main changes are summarised here, and further details can be found in Bechtold et al. (2020).
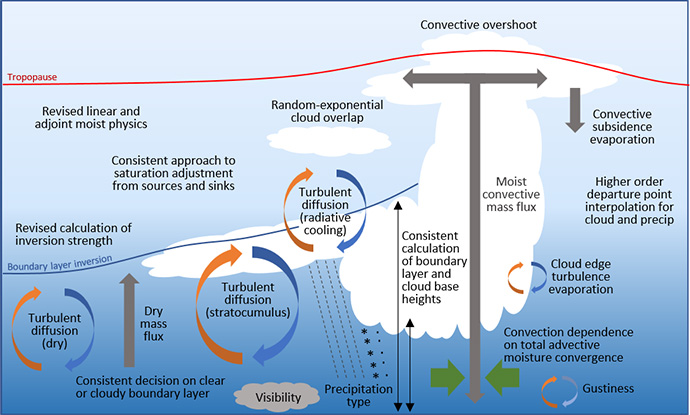
- In the revised turbulence scheme, the methods of determining a clear or cloudy mixed layer and the heights of the mixed layer and cloud base are now consistent with those in the convection scheme. The calculation of the strength of the inversion at the top of the mixed layer has been revised, and the saturation adjustment process from the turbulent mixing that was previously treated with a separate statistical cloud scheme is now treated more consistently with the prognostic cloud scheme.
- The formulation of the saturation adjustment (condensation/evaporation) process for partially cloudy grid boxes was revised and simplified with the removal of a first-guess adjustment before the convection scheme and more consistent assumptions for ice supersaturation in the clear-air part of the grid box. This affects cloud cover with a higher occurrence of fully cloudy grid boxes. The simplifications to the saturation adjustment facilitate future development of the moist physics processes and interactions.
- A stronger coupling of the convection parametrization with the dynamics, through total advective moisture convergence in the convective instability calculations, helps to improve the representation of mesoscale convective systems and their propagation, on average, at both current and future operational resolutions (Becker et al.). There are other impacts on the precipitation that are discussed in the next section.
- There are changes to the cloud vertical overlap parametrization used in the radiation scheme and total/high/medium/low cloud cover products. The overlap of two separated cloud layers was previously dependent on the exponential of separation distance but is now changed to random overlap, in agreement with observations. Overlap for model levels within a contiguous cloud are still treated with the exponential of separation approach. This generally acts to increase cloud cover, which is also modified by changes to the cloud edge turbulent erosion, subsidence evaporation and saturation adjustment.
- The semi-Lagrangian departure point interpolation is changed from linear to cubic for the advection of the cloud liquid, cloud ice, rain and snow prognostic variables to be consistent with the humidity and cloud fraction variables. A 3D quasi-monotone limiter is activated to avoid overshoots and negative values. The higher order interpolation leads to less numerical smoothing and smaller-scale structure of cloud and precipitation fields in the forecast.
- There are updates to the ensemble Stochastically Perturbed Parametrization Tendencies (SPPT) scheme to reduce the upper-tropospheric tropical temperature warm bias that arises from the addition of stochastic perturbations.
- The simplified moist physics formulation for the tangent-linear and adjoint model is an important part of the 4D variational assimilation system and has been updated in 47r3 to be more consistent with the revised physics parametrizations in the forecast model.
Impact on medium- and extended-range forecasts
The changes in Cycle 47r3 have been extensively tested across the different resolutions and configurations of the IFS at medium-range, extended-range and seasonal timescales. The extended-range ensemble was evaluated with forecasts initialised at the start of each month for the period 1989–2016. Case studies at the higher horizontal resolution of 4 km were also conducted to assess the impacts on future operational upgrades.
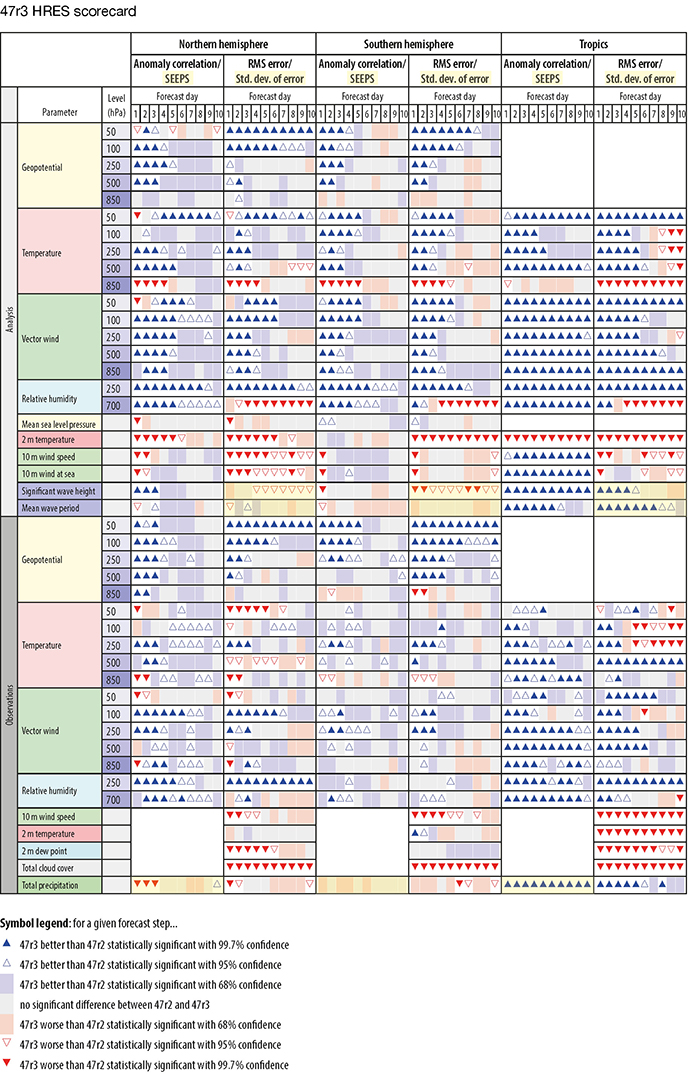
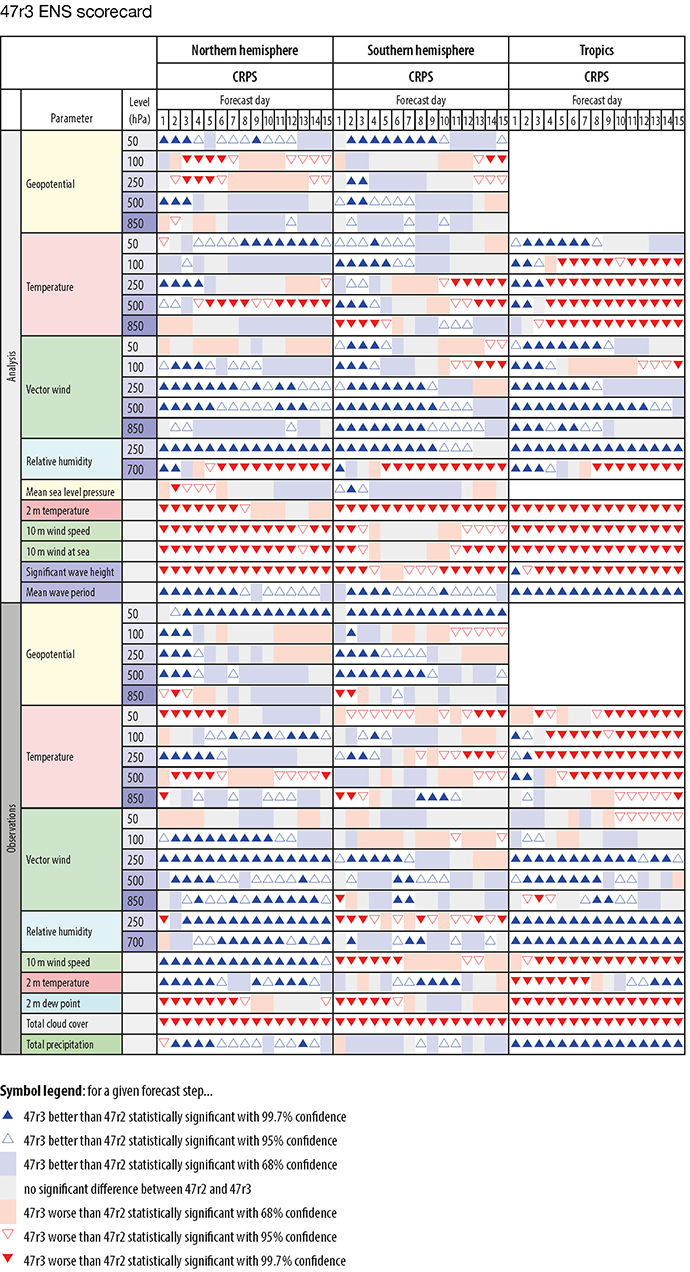
Figures 3 and 4 show medium-range scorecards for Cycle 47r3 relative to own analysis and observations, for the HRES and ENS, respectively (interactive scorecards are available from the 47r3 implementation web page: https://confluence.ecmwf.int/display/FCST/Implementation+of+IFS+Cycle+47r3). There are many positive impacts of the Cycle, particularly on upper-air scores and tropical cyclone tracks. There are also some deteriorations, and both are discussed below.
Upper-air geopotential and wind in the first few days of the forecast are significantly improved (Figure 5), by up to a few per cent for the northern hemisphere 500 hPa geopotential anomaly correlation, reducing with lead time. Upper-air winds are particularly improved in the tropics throughout the medium range, by up to 7%, reducing with lead time. Tropical upper-air temperatures are improved in HRES but degraded in the ENS from a small (~0.2 K) increase in bias due to a warming by the stochastic perturbations (partly mitigated by the SPPT changes mentioned above). Low level temperatures (including 850 hPa and 2 m temperature) are approximately neutral versus observations but degraded versus analyses in the subsidence regions over subtropical oceans, where the temperature at 850 hPa is very sensitive to small changes in boundary layer height.

For tropical cyclones, there is a 10% improvement in the track location errors in both HRES and in the ensemble mean of ENS (Figure 6) from forecast days 2 to 5, due to a combination of the additional observations assimilated in cloudy regions and model changes which improve the steering flow. With little change in spread, this results in an improvement in the statistical reliability of the tracks. The tropical cyclone central pressure is shallower on average by 2–3 hPa in Cycle 47r3. The difference can be greater than this in the rapidly deepening phase, with Cycle 47r2 closer to the ‘best-track’ central pressure data (reported by the official global monitoring centres), but of opposite sign in the later stages, where Cycle 47r3 is closer to the ‘best-track’ data. Tests at a higher resolution (4 km) show generally deeper tropical cyclones in both model versions, but Cycle 47r2 more frequently over-deepens, whereas Cycle 47r3 at 4 km resolution is in overall closer agreement with best-track central pressure values. The physics of Cycle 47r3 thus better prepares the IFS for future increases in horizontal resolution.

The impact on near-surface parameters is more mixed. There is a small improvement in 2 m temperature in the extratropics, but a small degradation in the tropics. Two-metre dew point and 10 m wind also show small deteriorations. A 3% increase in bias of total cloud cover as well as an increase in small scale variability and more binary (0/1) cloud cover leads to a degradation in the calculated scores. With such a major physics change, it is inevitable that there are some degradations, and these will be investigated further for later IFS cycles.
A key focus for the moist physics upgrade is precipitation. There are significant changes in the characteristics of precipitation, including enhanced fine-scale structures, reduced areal coverage and higher peak precipitation rates. The PDF (probability density function) of precipitation rate is improved, with reduced occurrence of light precipitation rates and increased occurrence of high precipitation rates in convective regimes, but similar precipitation accumulations overall. This is particularly evident over continental regions such as the USA and Africa, in better agreement with radar and satellite-based precipitation estimates. Along the intertropical convergence zone (ITCZ) there are reductions in the number of overactive quasi-stationary precipitation cells, which has been a longstanding problem in the IFS. The relative change in the 99th percentile for precipitation in the model climate at day 2 shows this reduction along the ITCZ (Figure 7). The figure also shows increased convective precipitation in semi-arid regions, for example reducing the dry bias around the Mediterranean in summer, but little change in the statistics of extreme precipitation accumulations in the rest of the extratropics.

The overall precipitation scores show some positive signals. For tropical precipitation, the HRES shows improvements of 1–2% in the deterministic SEEPS (stable equitable error in probability space) score, and the ENS shows improvements of about 0.6% in the fair CRPS (continuous ranked probability score). In the extratropics, the HRES impact is generally neutral while the ENS again shows improvements.
For the extended range, the impact of the physics changes on full-resolution ensemble re-forecasts includes a general increase in spread of a few per cent, particularly in the tropics. Although there are some increases in bias (for example 850 hPa temperature), consistent with the medium range, the impact on bias-corrected scores is approximately neutral (slightly positive in the tropics). The forecast skill of the Madden–Julian Oscillation (MJO) is slightly improved. The overall increase in spread of the MJO index leads to a slight over-dispersion, especially from the 850 hPa zonal wind component of the index. However, the MJO amplitude is increased for lead times greater than five days, reducing amplitude bias (e.g. from –15% to –10% at day 10) and eastward phase bias. There is no significant impact on the frequencies of Euro-Atlantic regimes.
New and revised products
Cycle 47r3 also includes a revision of several forecast products, including an improved calculation of (i) visibility, reducing biases in fog, rain and snow, (ii) wind gusts, reducing an overestimate, (iii) precipitation-type, improving the diagnosis of ice pellets and freezing rain, and (iv) the peak wave period for ocean waves when there are multiple peaks. There are also several new forecast products requested by Member States, including ‘MUCAPE’ (most-unstable convective available potential energy) now using virtual potential temperature, two new variants of mixed-layer CIN (convective inhibition) and CAPE, and a clear air turbulence (CAT) diagnostic (Bechtold et al., 2021).
Summary
Cycle 47r3 brings a major revision to the representation of moist physics in the IFS as well as improvements in the assimilation of observations and increased usage of satellite data in cloudy regions through the extension of the ‘all sky’ approach.
An important impact on the forecast is the improvement of the atmospheric circulation, as seen in the increase in skill of extratropical geopotential heights and winds, and with a reduction in wind errors in the tropics of several per cent. The ensemble-mean of error in tropical cyclone position is reduced by 10% between forecast days 2 and 5. There are changes to the character of precipitation, with improvements in the precipitation PDF and in strongly forced convective systems. As well as the many positive signals, a significant change in the physics inevitably leads to some deteriorations, for example in total cloud cover, and these will be addressed in future IFS cycles. There are several new forecast products, such as clear-air turbulence, and improvements to existing products, including visibility and wind gusts.
Overall, the package of changes in Cycle 47r3 is an important step in the development of the IFS, improving performance overall, extending our use of existing observations and providing a stronger foundation for further development of the model and data assimilation at current and higher resolutions.
Further reading
Bechtold, P., R. Forbes, I. Sandu, S. Lang & M. Ahlgrimm, 2020: A major moist physics upgrade for the IFS, ECMWF Newsletter No. 164, 24–32.
Bechtold, P., M. Bramberger, A. Dörnbrack, M. Leutbecher & L. Isaksen, 2021: Forecasting clear-air turbulence, ECMWF Newsletter No. 168, 32–37.
Becker, T., P. Bechtold & I. Sandu: Characteristics of convective precipitation over tropical Africa in storm-resolving global simulations, Quarterly Journal of the Royal Meteorological Society, accepted.
Duncan, D., N. Bormann, A. Geer, & P. Weston, 2021: Assimilation of AMSU-A in all-sky conditions. EUMETSAT/ ECMWF Fellowship Programme Research Report No. 57.
Lean, K. & N. Bormann, 2021: Using model cloud information to reassign low level AMVs for NWP. EUMETSAT/ECMWF Fellowship Programme Research Report No. 56.